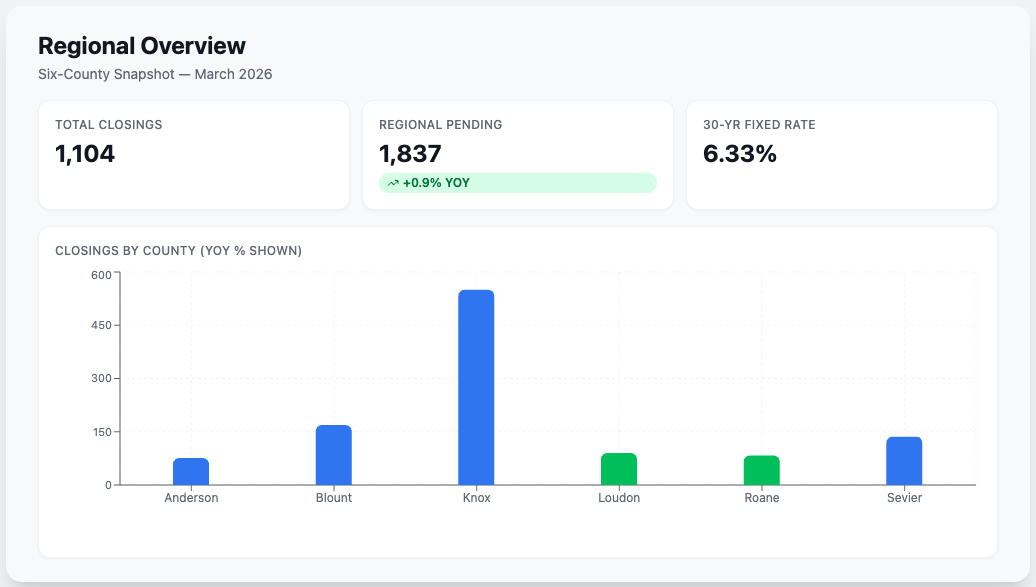
If you’re thinking about buying or selling a home in Knoxville, Knox County, or anywhere in the greater East Tennessee region, the March 2026 numbers deserve your attention. The market is shifting … not crashing, not booming, but recalibrating in ways that create real opportunities if you know where to look and real risks if you don’t.
Every month, we pull the latest data from the East Tennessee MLS across our six-county service area: Knox, Blount, Anderson, Loudon, Roane, and Sevier counties, and break down what the numbers actually mean for people making real decisions about real estate. This month’s data tells two very different stories depending on where you’re looking and whether you’re on the buying or selling side of the transaction.
Here’s everything you need to know.
The Big Picture: East Tennessee Real Estate in March 2026
Across the six-county East Tennessee market, the headline numbers look soft. Closed sales are down year-over-year in most counties, and inventory continues to build in some of the outlying markets. If you stopped there, you might think the market is in trouble.
But the story underneath the surface is more nuanced. Pending sales — which are the best leading indicator we have of where the market is heading over the next 30 to 60 days — are climbing in nearly every county. In some cases, they’re climbing significantly. That disconnect between closings and pendings tells us something important: buyer activity is picking up, but the deals haven’t hit the closing table yet. The spring market may be arriving late, but it appears to be arriving.
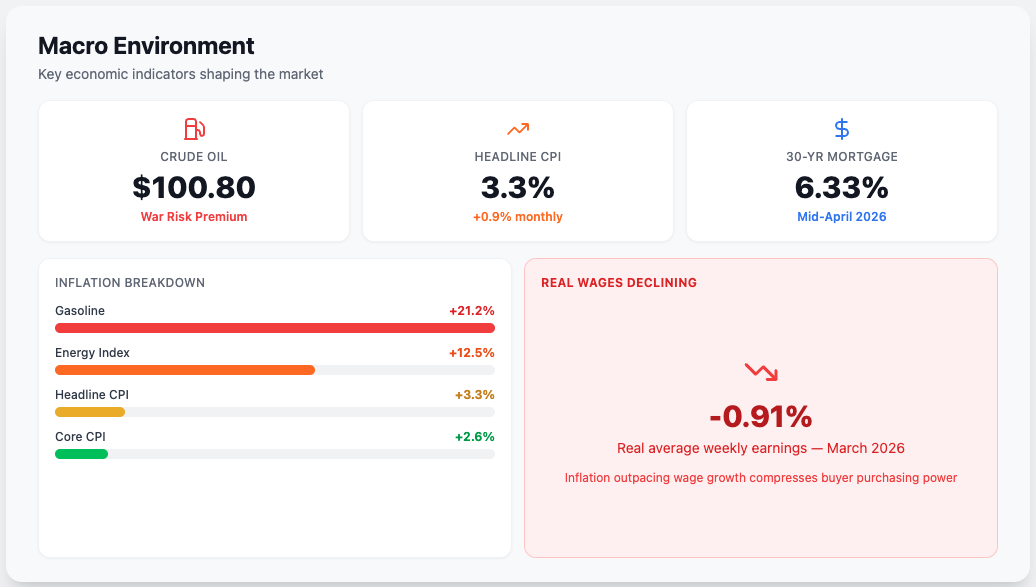
At the same time, the macroeconomic backdrop is putting pressure on affordability that wasn’t there a year ago. Mortgage rates remain stubbornly above 6.3%, oil prices have pushed past $100 per barrel for the first time since 2022, and real wages — when adjusted for inflation — are actually declining. All of that matters because it shapes what buyers can afford and what sellers can realistically expect.
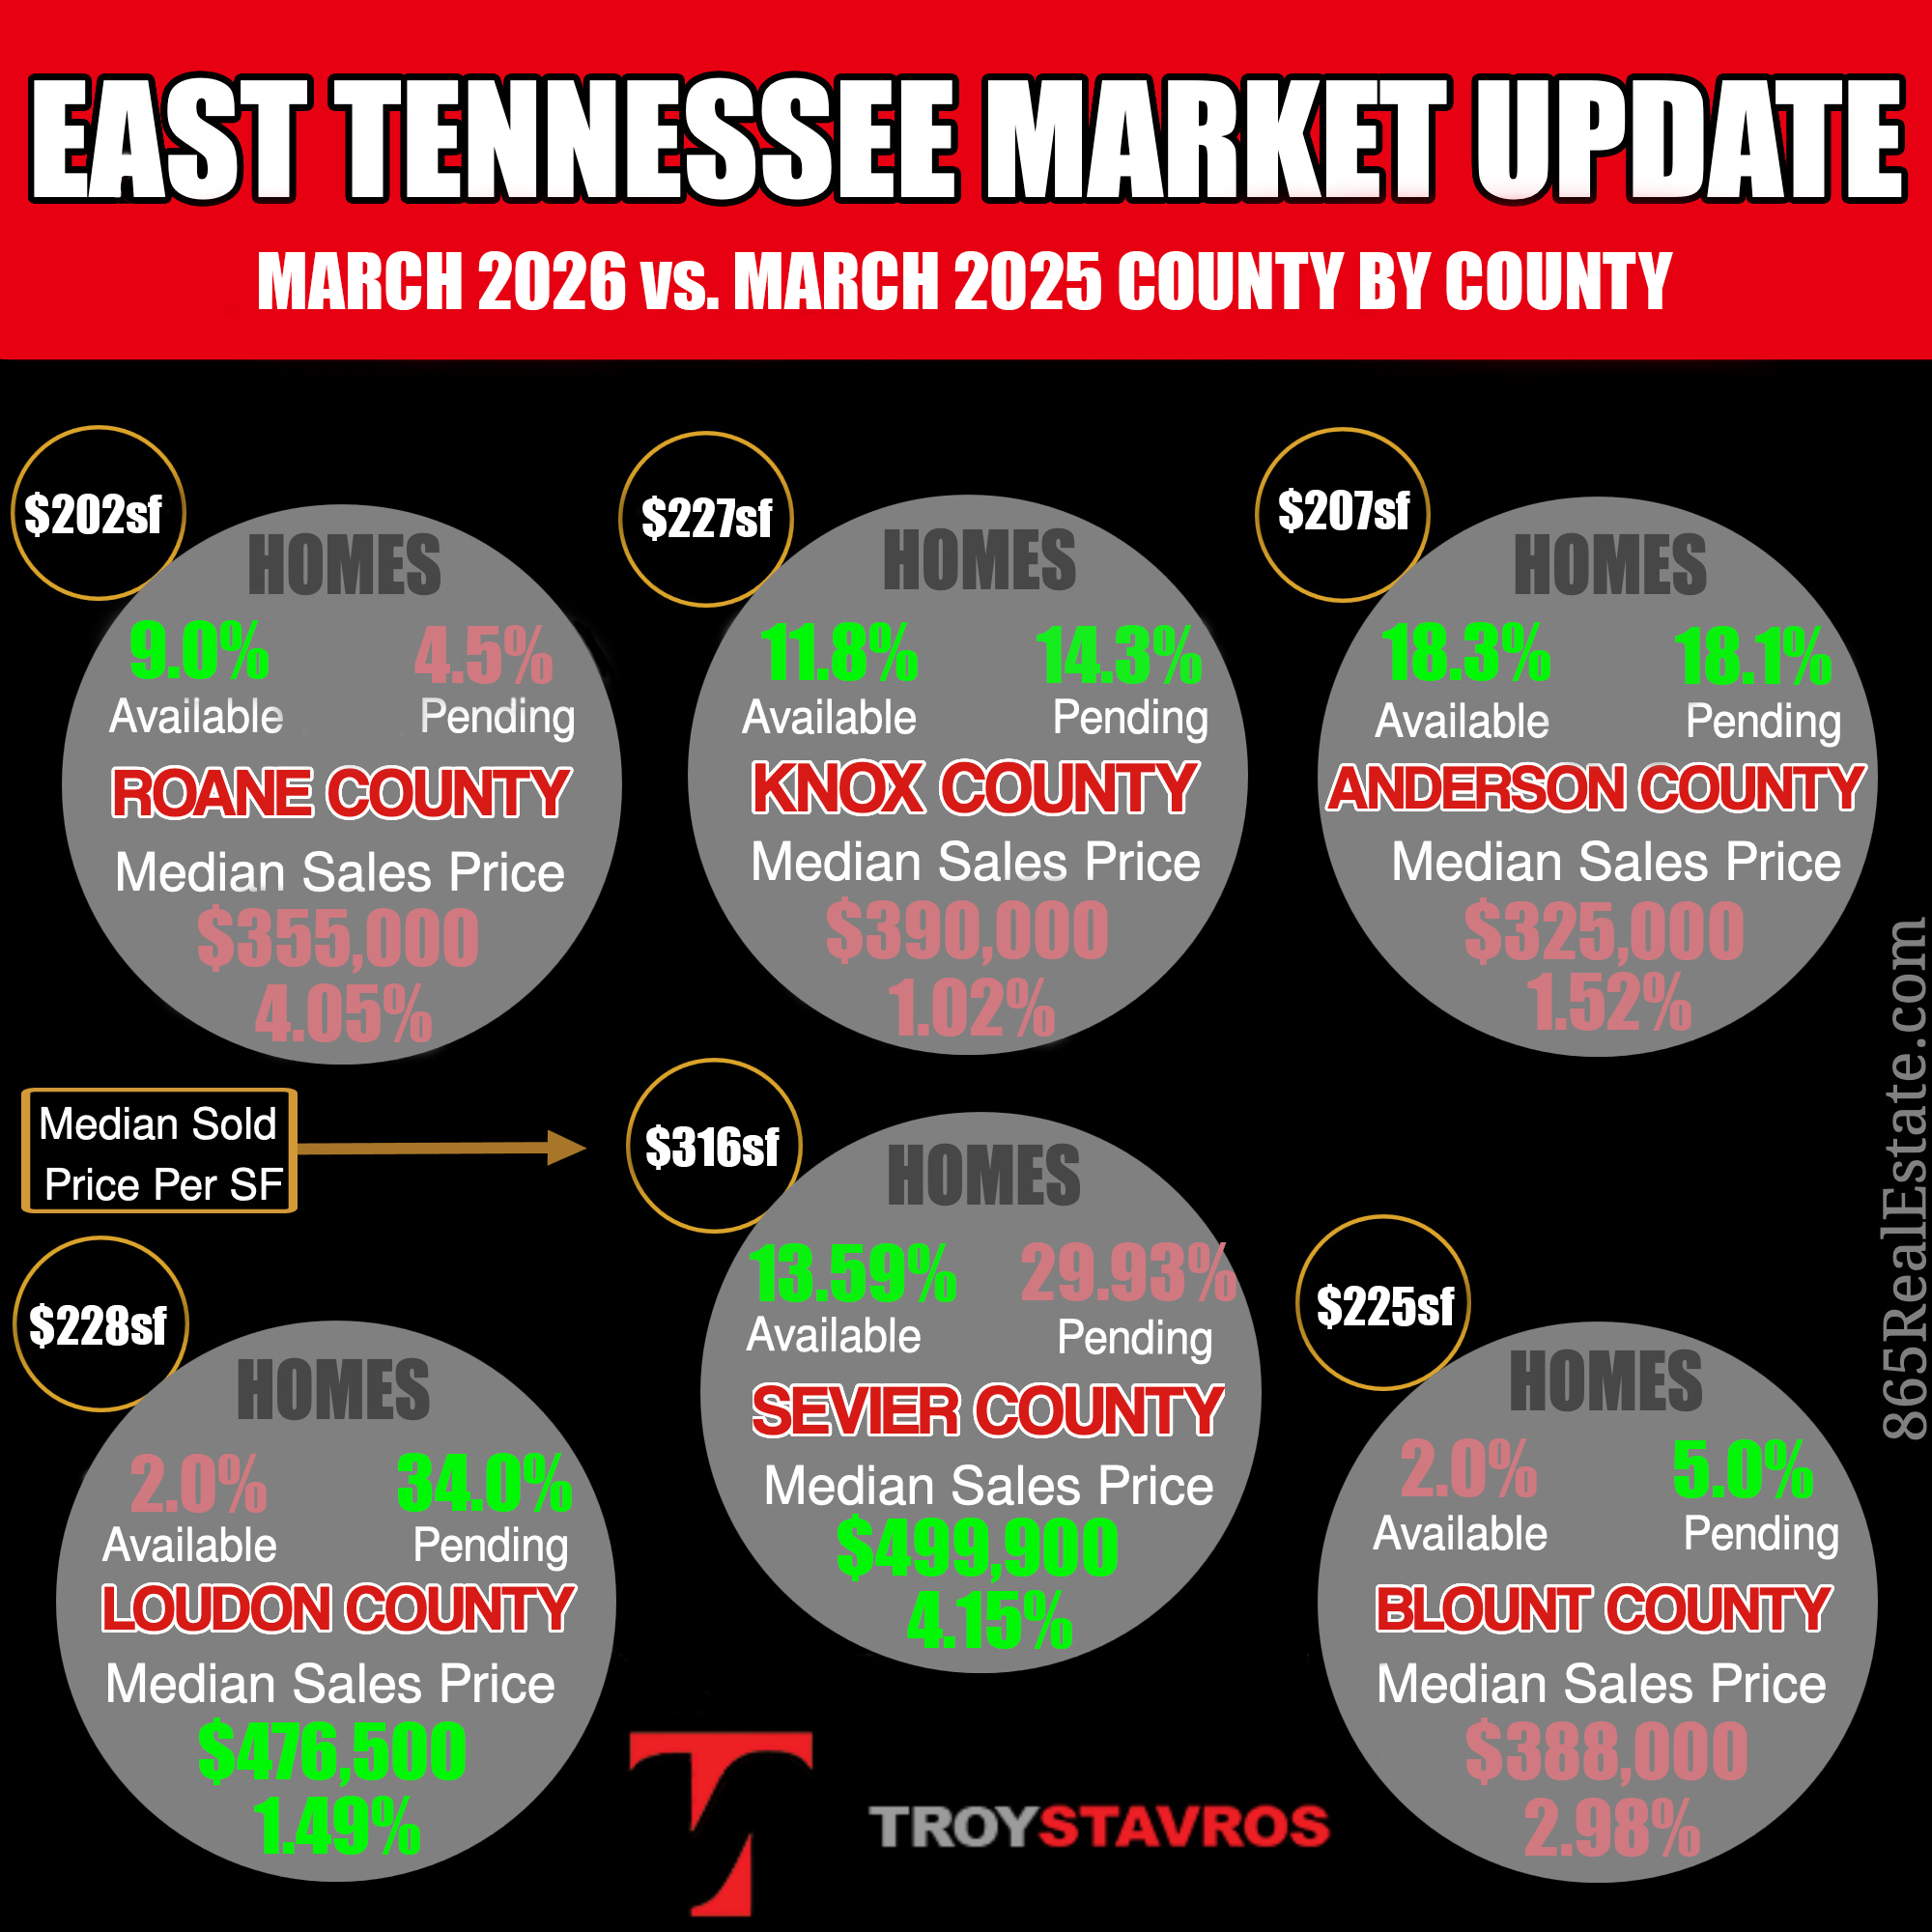
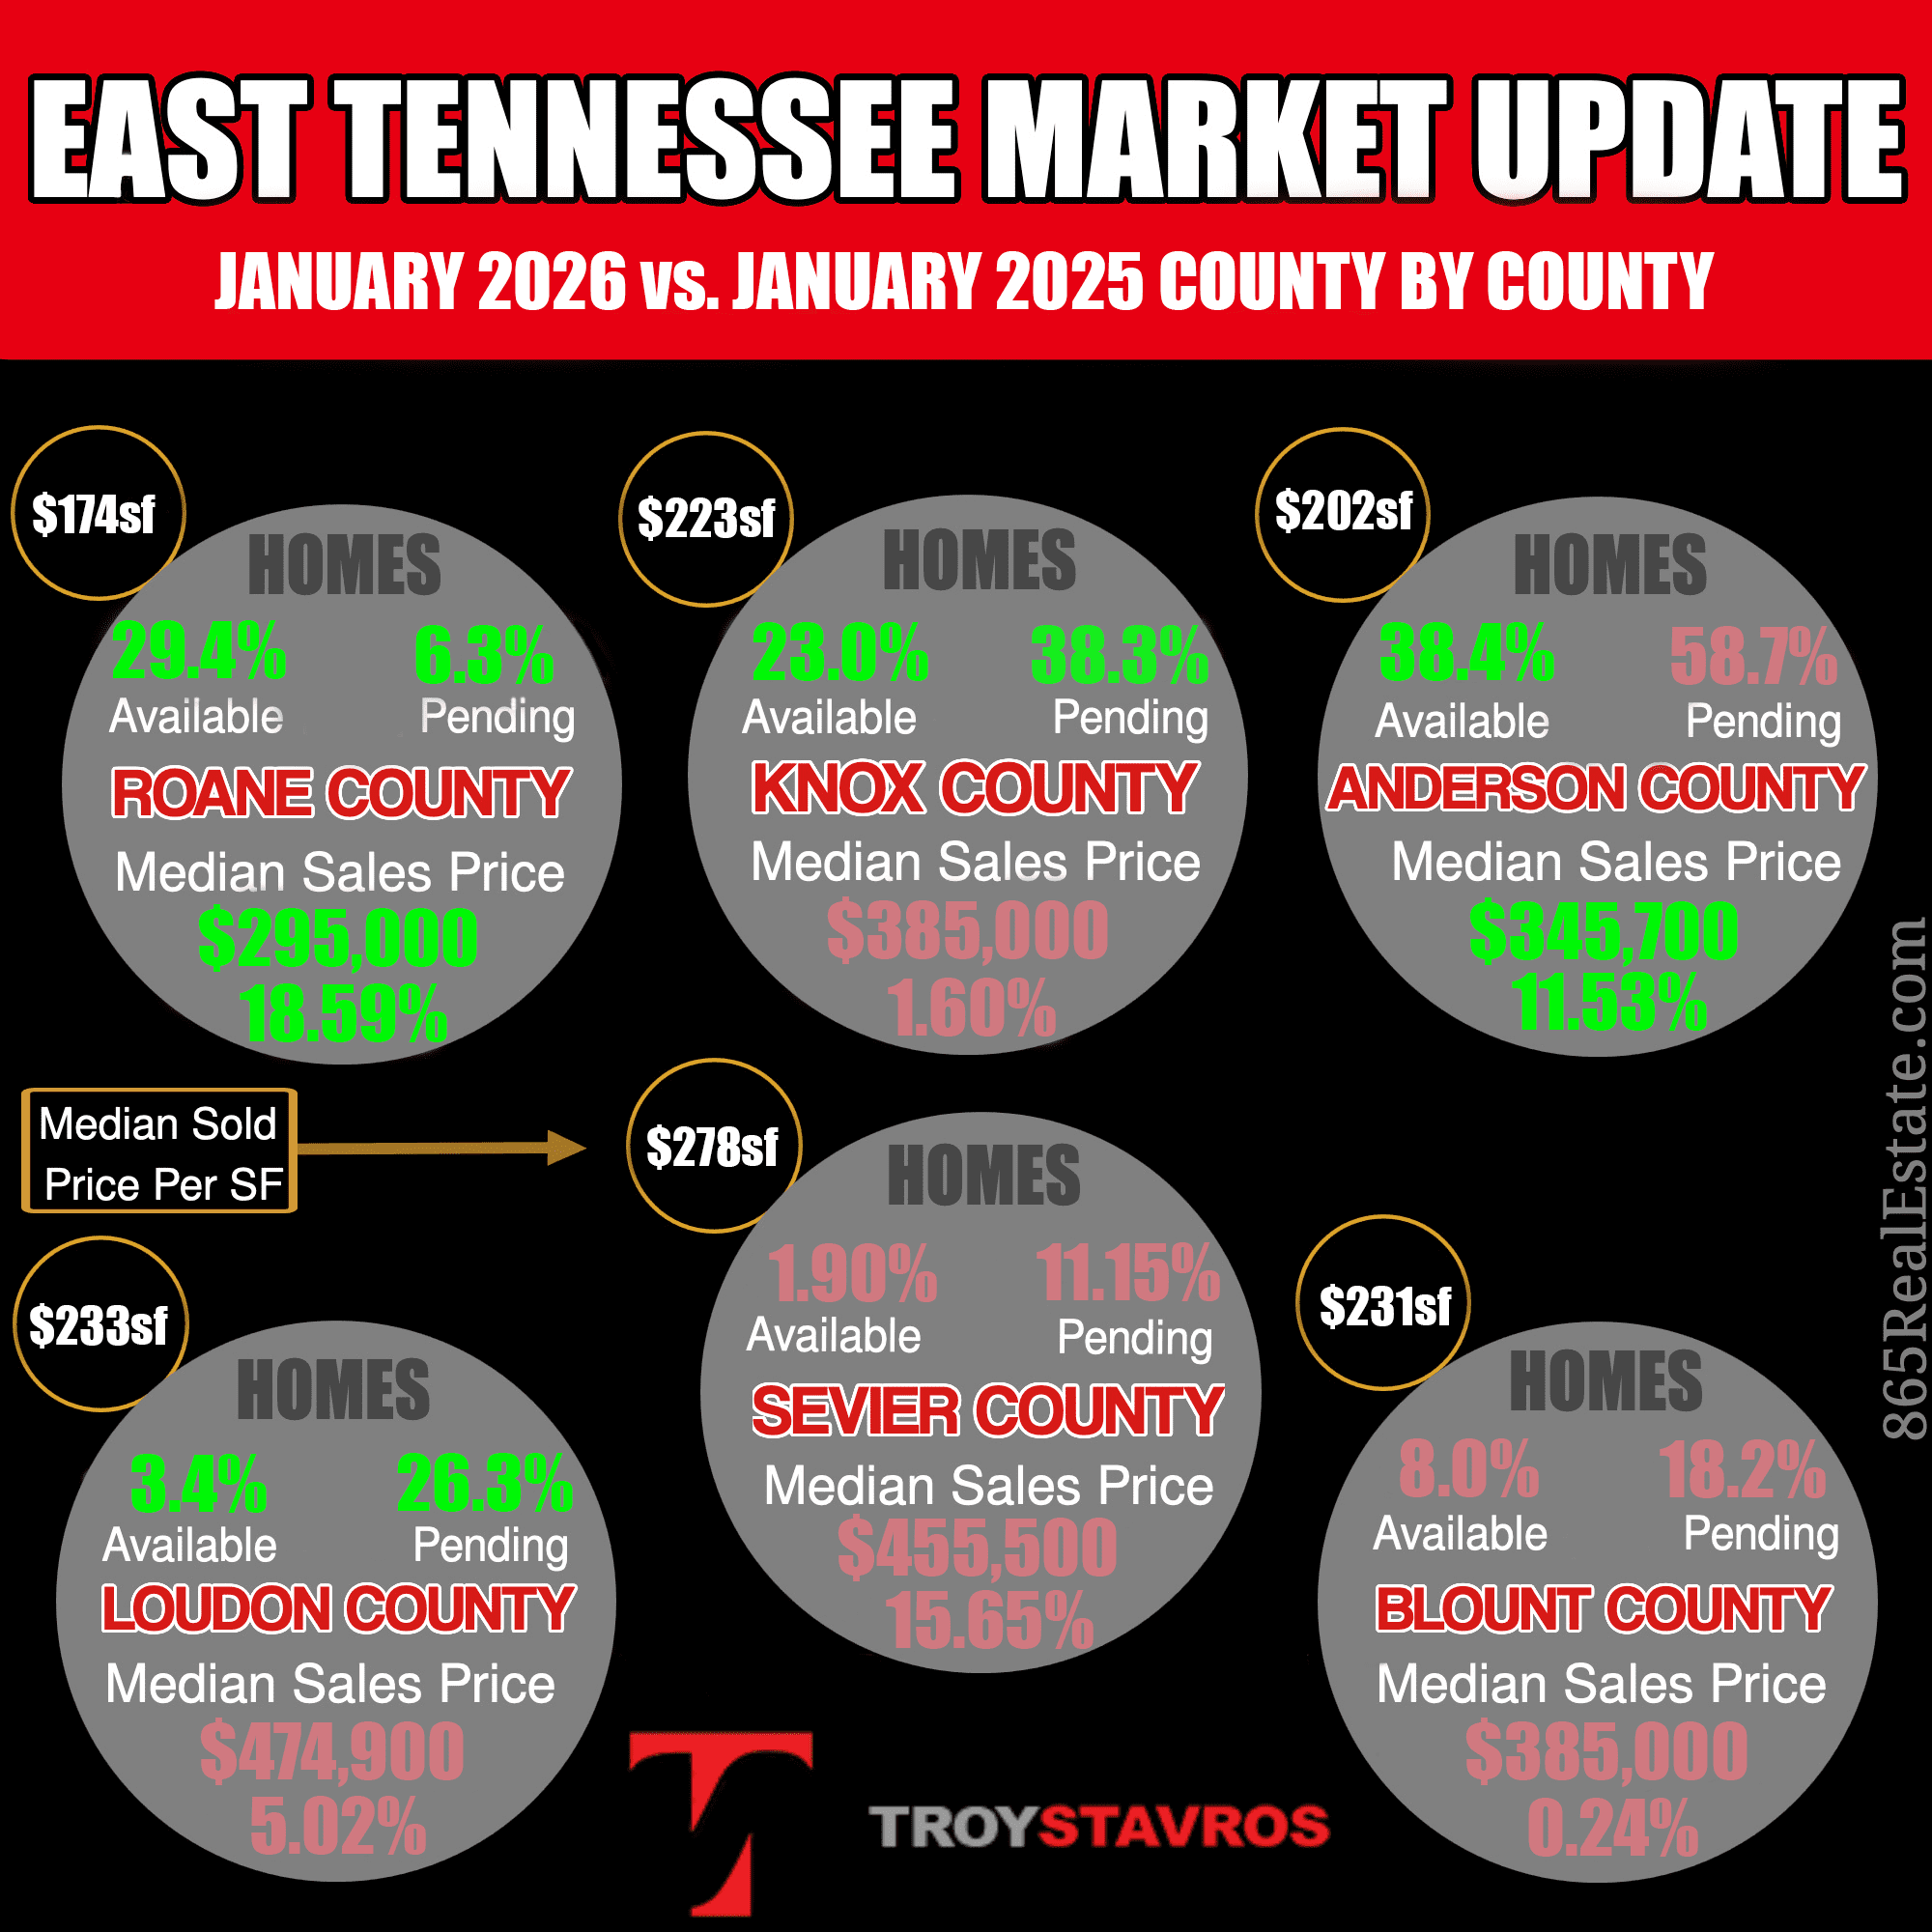
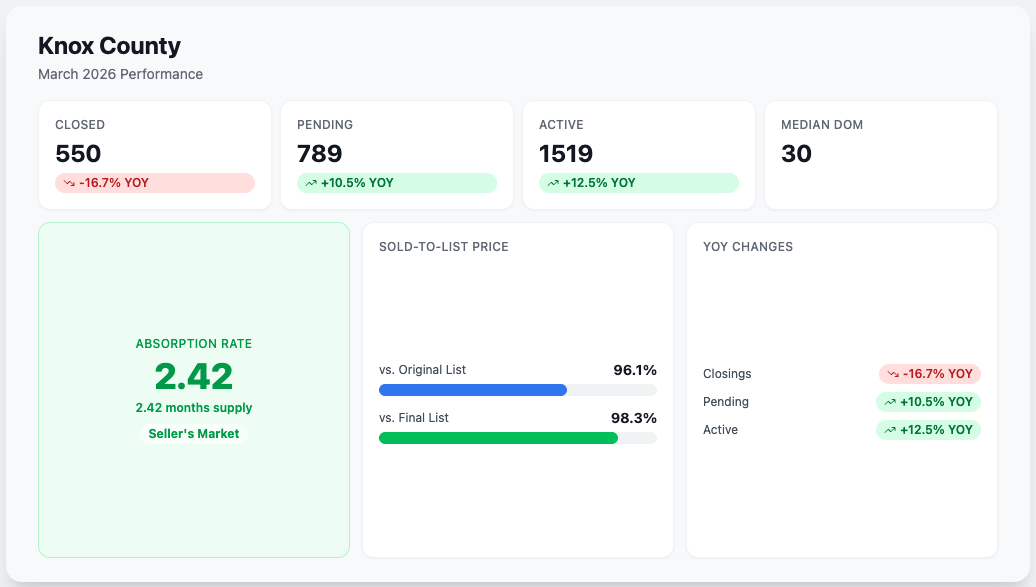
Knox County Housing Market: The Engine of the Region
Knox County remains the largest and most closely watched market in East Tennessee, and the March numbers reflect a market that’s cooling on the surface but heating up underneath.
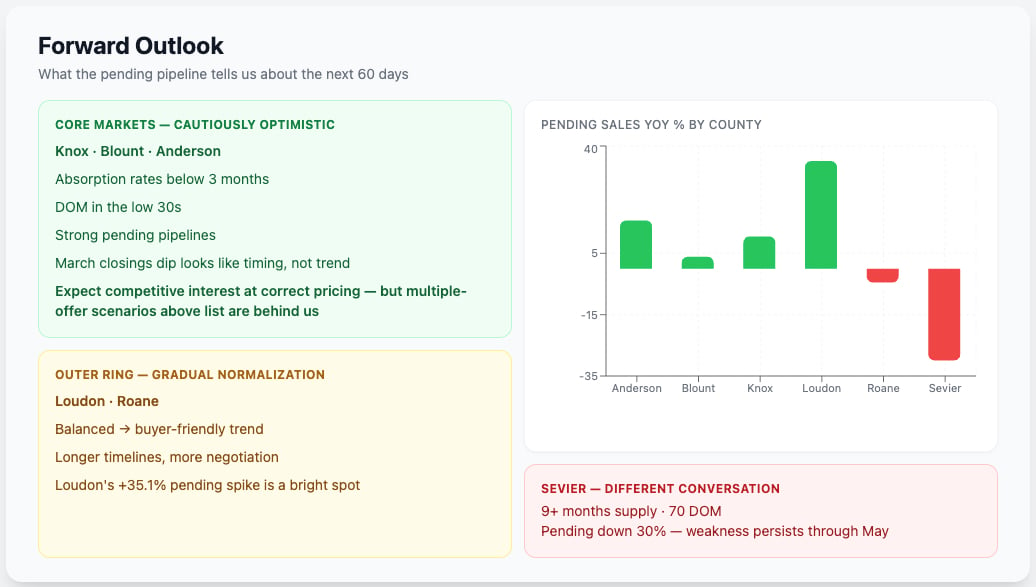
Closed sales in Knox County fell 16.7% year-over-year in March. That’s a meaningful decline, and it’s the kind of number that grabs headlines. But context matters. Part of that decline is a comparison issue — March 2025 was an unusually strong month. And more importantly, pending sales in Knox County rose 10.5% over the same period. That means more buyers are going under contract now than they were a year ago, even if fewer deals closed last month.
For sellers in Knox County, this means the market still has demand, but you need to be realistic about pricing. Overpriced homes are sitting. Homes priced correctly for the current rate environment are still moving, and in many neighborhoods, they’re moving with multiple offers. The days of listing 10% above comps and expecting a bidding war are behind us for now, but the days of well-priced homes selling quickly are not.
For buyers in Knoxville and Knox County, the math is actually improving. You have more inventory to choose from than at any point in the last three years, and the urgency that defined the 2021–2023 market has faded. That gives you negotiating leverage that simply didn’t exist before. If you’ve been waiting for a window, this may be it — especially if rates ease later this year.
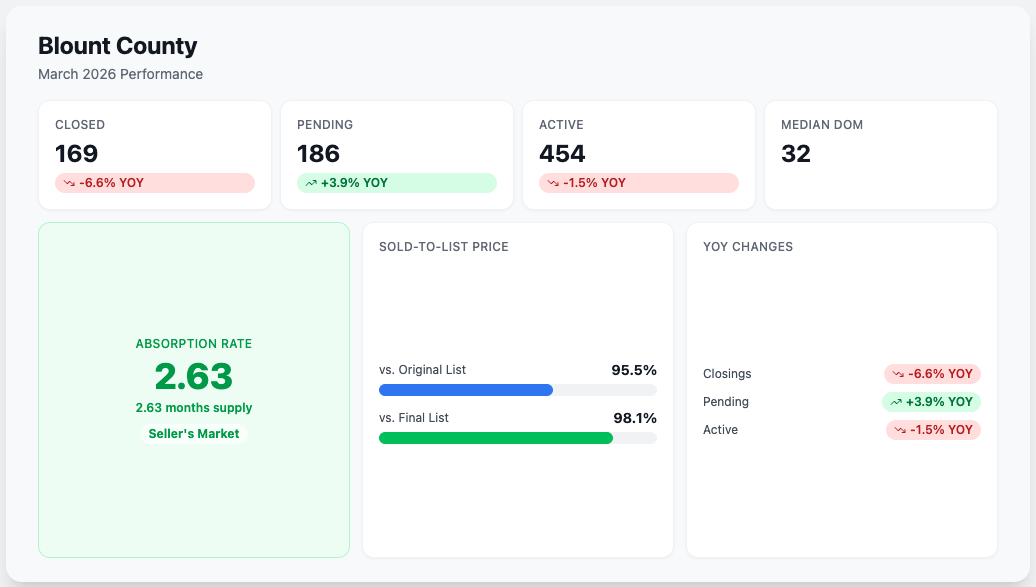
Blount County Real Estate: Still One of the Tightest Markets in the Region
Blount County continues to be one of the most competitive markets in East Tennessee, and the March data reinforces that. While inventory has loosened slightly compared to the peak tightness of 2022 and 2023, Blount County still operates with relatively low months of supply compared to its neighbors.
Maryville and Alcoa remain popular with buyers who want proximity to Knoxville without Knoxville price tags, and the school systems in Blount County continue to be a draw for families relocating to the area. Demand here hasn’t softened as much as in some of the other counties, which means sellers in Blount County are in a relatively strong position — particularly if they own homes in the sub-$400,000 range where buyer activity is most concentrated.
If you’re looking to buy in Blount County, be prepared for a market that feels slightly more competitive than what you’ll find in Knox or Anderson County right now. Good homes in desirable neighborhoods are still generating interest quickly, and while you have more room to negotiate than you did two years ago, you may not have as much room as you’d find in some of the outer-ring counties.
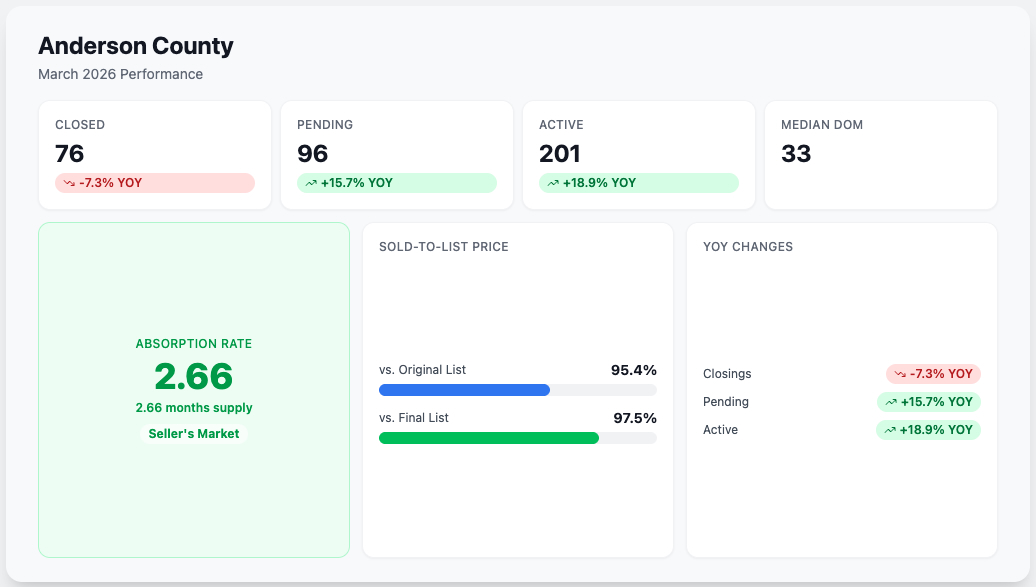
Anderson County Housing Market: Pending Sales Surge 15.7%
Anderson County is quietly having one of the stronger springs in the region. Pending sales jumped 15.7% year-over-year in March — a number that stands out across the entire six-county area. Communities like Oak Ridge, Clinton, and Norris are seeing renewed buyer interest, and the county’s relative affordability compared to Knox and Blount is a significant factor.
For buyers who are priced out of West Knoxville or South Knoxville but still want to commute into the city, Anderson County offers a compelling value proposition. Median home prices here remain well below the Knox County median, and the inventory situation gives buyers more options and more time to make decisions without the pressure of immediate competition.
Sellers in Anderson County should take note of the pending sales momentum. If you’ve been on the fence about listing, the data suggests that buyer activity is accelerating here. Homes that are clean, well-maintained, and priced appropriately for the Anderson County market are finding buyers — and the spring selling season appears to be gaining traction.
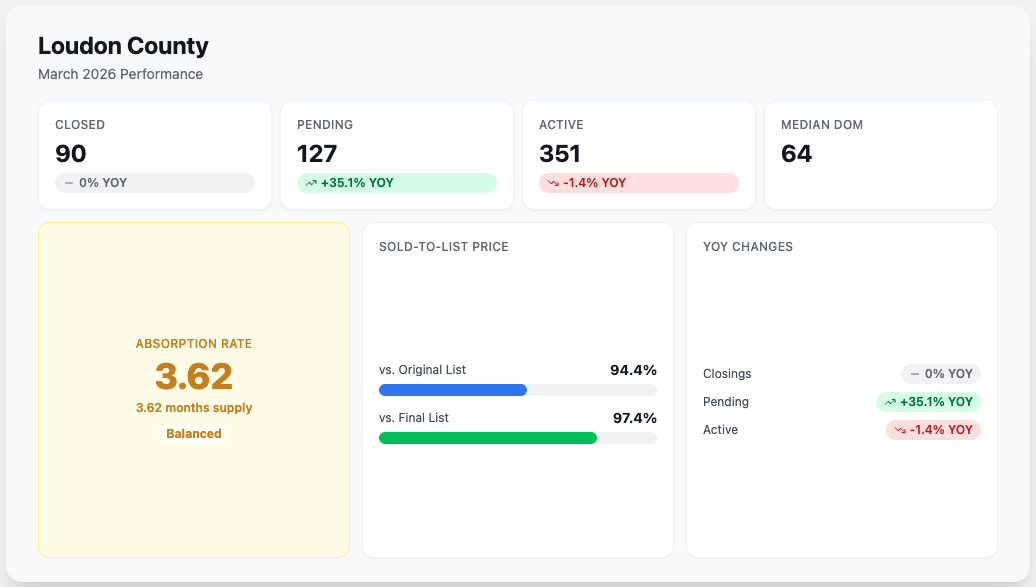
Loudon County Real Estate: A 35% Jump in Pending Sales
The standout number in the entire six-county region this month belongs to Loudon County, where pending sales surged 35% year-over-year. That’s not a typo, and it’s not a small-sample-size anomaly. Something is happening in Loudon County.
Lenoir City and the lakefront communities along Tellico Lake and Fort Loudoun Lake continue to attract retirees, second-home buyers, and remote workers who want a more rural lifestyle within striking distance of Knoxville. The county’s combination of natural beauty, relative affordability, and lifestyle appeal is resonating with a buyer pool that appears to be growing.
For sellers in Loudon County, this pending sales surge is a strong signal. Demand is building, and if you’ve been waiting for the right time to list, the spring market is shaping up favorably. For buyers, the opportunity here is getting in ahead of what could be a tightening market later in the year. If pending sales continue at this pace, inventory will start to compress, and the leverage buyers currently enjoy may not last through summer.
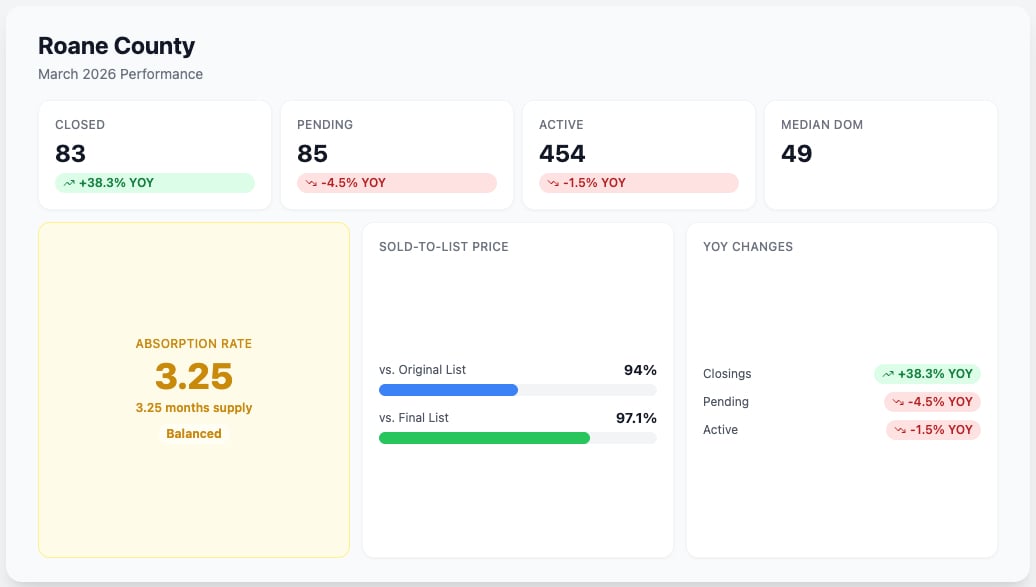
Roane County: The Sleeper Market Nobody’s Watching
Roane County rarely makes headlines in East Tennessee real estate conversations, and that’s precisely why it deserves attention. The county — anchored by Harriman, Kingston, and Rockwood — offers some of the most affordable housing in the region, and the March data shows a market that is quietly healthy.
For buyers looking for value, Roane County is where you’ll find it. Median prices remain significantly below the regional average, and the inventory situation is favorable for buyers who want time and options. This is not a market defined by bidding wars or waived inspections. It’s a market where you can buy a solid home at a reasonable price with room to negotiate.
For investors, Roane County’s price-to-rent ratios are among the most attractive in the region. If you’re building a rental portfolio in East Tennessee and you’re finding Knox County cap rates too compressed, Roane County warrants a serious look.
Sellers in Roane County should understand that this is a more patient market. Homes take longer to sell here than in Knox or Blount, and pricing precision matters more. But the fundamentals are stable, and well-priced properties are transacting.
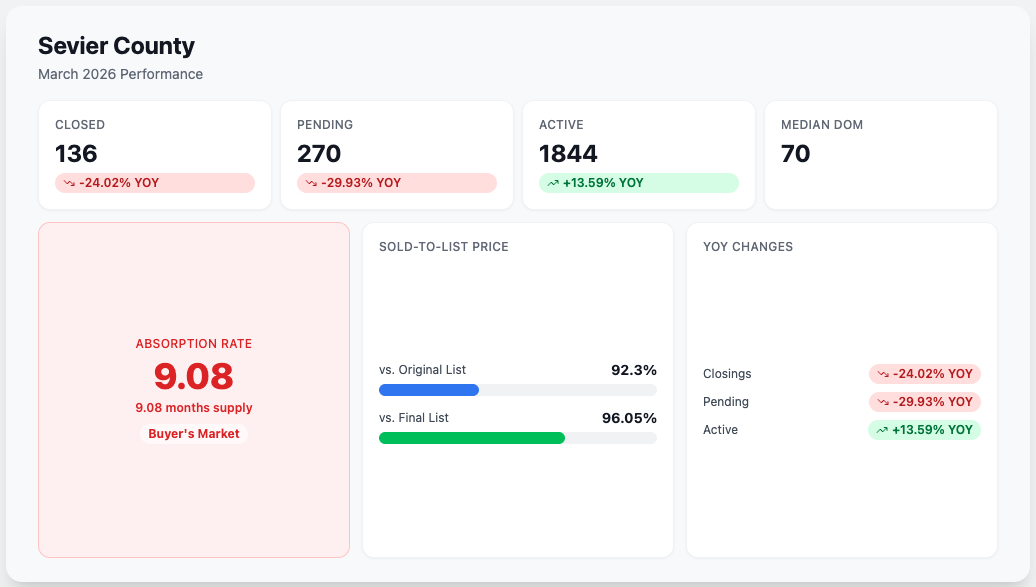
Sevier County Housing Market: 9 Months of Supply and a Shifting Landscape
If there’s one county in our service area where the data raises real questions, it’s Sevier County. Months of supply have pushed past 9 months — a level that, by traditional real estate metrics, places the county firmly in buyer’s market territory. Closings are down, and the overall trajectory has been softening for several consecutive months.
The Sevier County market is unique because of its heavy dependence on short-term rental investment properties. Gatlinburg, Pigeon Forge, and Sevierville have been among the hottest short-term rental markets in the country for the past five years, and the influx of investor capital drove prices to levels that look stretched by almost any conventional metric. Now, as short-term rental revenue softens in some segments and regulatory conversations continue at the local and state level, some of that investment thesis is being tested.
For buyers interested in Sevier County — whether for a primary residence, a vacation home, or an investment property — the leverage has shifted meaningfully in your favor. There are more options, more negotiating room, and more motivated sellers than at any point since the pandemic began. If your investment underwriting works at current prices, the buying environment is favorable.
For sellers in Sevier County, the message is straightforward: price matters more here than anywhere else in the region right now. With 9 months of supply on the market, overpriced listings are being ignored entirely. The properties that are selling are the ones priced to reflect current conditions, not conditions from 2022 or 2023. If you need to sell, work with an agent who understands the current Sevier County data and can position your property to stand out in a crowded market.
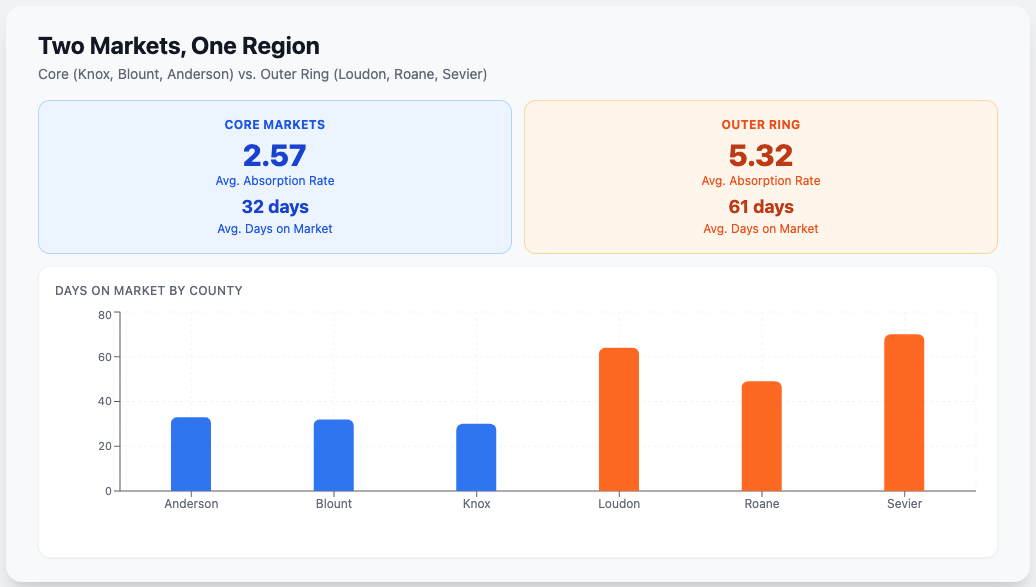
Core Markets vs. Outer Ring: Two Very Different Stories
One of the most important themes in this month’s data is the divergence between what we call the core markets — Knox and Blount counties — and the outer ring markets of Anderson, Loudon, Roane, and Sevier counties.
The core markets are performing with more resilience. Demand remains relatively stable, inventory is manageable, and the fundamental drivers of value — jobs, schools, healthcare, infrastructure — continue to attract buyers. Knox and Blount counties benefit from the gravitational pull of Knoxville’s economy, the University of Tennessee, and a healthcare sector that employs tens of thousands of people. These are markets where demand has a floor because people need to live near where they work.
The outer ring tells a more varied story. Anderson and Loudon counties are seeing surging buyer interest, driven largely by affordability migration from the core. Roane County is stable but quiet. And Sevier County is dealing with the consequences of a short-term-rental-driven price expansion that is now correcting.
This divergence matters because it means there is no single “East Tennessee housing market.” There are multiple markets operating under the same regional banner, each with its own dynamics, its own supply-demand balance, and its own set of opportunities and risks. The worst mistake you can make — whether you’re buying or selling — is assuming that the conditions in one county apply to another.
The Macro Picture: Why It Matters for East Tennessee Home Buyers and Sellers
Real estate is local, but it doesn’t operate in a vacuum. Several macroeconomic factors are shaping the environment for home buyers and sellers in East Tennessee right now, and ignoring them would be a mistake.
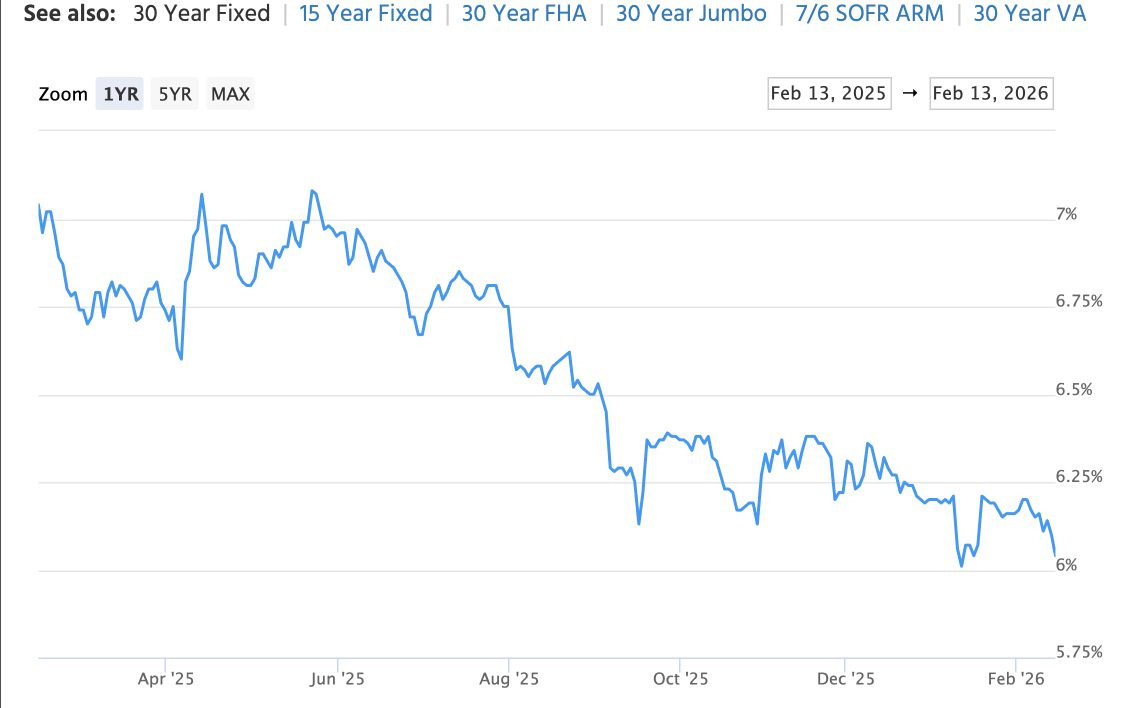
Mortgage rates remain above 6.3% as of mid-April 2026. For a buyer purchasing a $350,000 home with 10% down, that translates to a monthly principal and interest payment of approximately $1,960 — a number that is meaningfully higher than it would have been at the sub-3% rates available in 2021. Rates are the single biggest factor affecting affordability right now, and until they come down materially, the buyer pool for higher-priced homes will remain constrained.
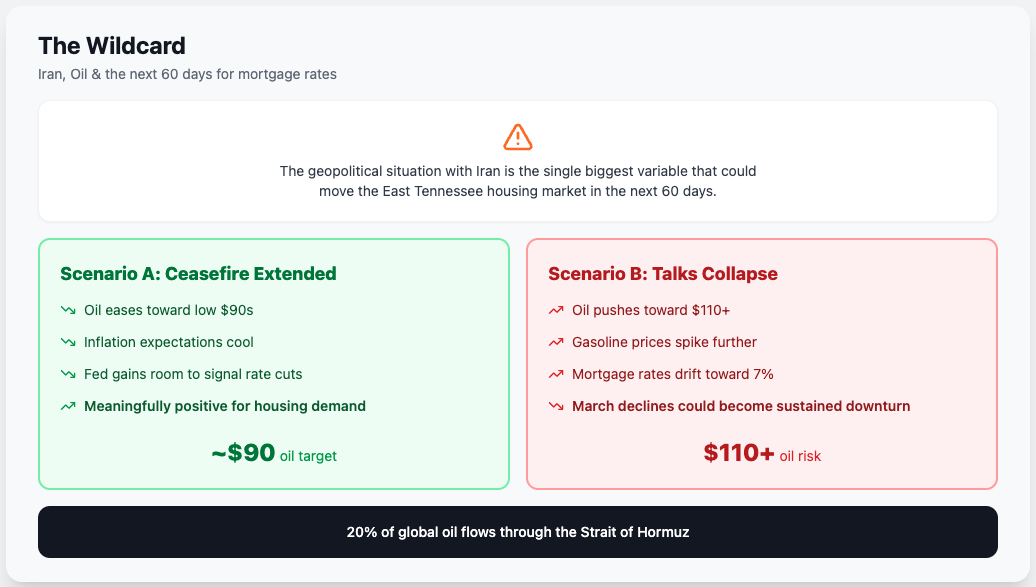
Oil prices have pushed above $100 per barrel, driven in part by geopolitical tension surrounding Iran and broader supply concerns. Energy prices feed into everything — transportation costs, construction material costs, and the general inflationary environment that has kept the Federal Reserve cautious about cutting rates. Higher oil prices are not directly a housing market story, but they contribute to the cost-of-living pressure that limits how much buyers can stretch for a home purchase.
Real wages — what workers earn after adjusting for inflation — are declining. According to the latest BLS data, the purchasing power of the average paycheck is lower today than it was a year ago. For a region like East Tennessee, where median household incomes are below the national average, this is a significant headwind. Buyers are feeling squeezed from multiple directions: higher rates, higher prices, and stagnant or falling real purchasing power.
The wildcard remains Iran and the broader geopolitical situation. Any escalation that further disrupts global energy markets could push oil higher, which would put upward pressure on inflation, which would keep the Fed from cutting rates, which would keep mortgage rates elevated. It’s a chain reaction that starts far from Knoxville but ends at the closing table.
What This Means If You’re Buying a Home in East Tennessee
If you’re a buyer in today’s East Tennessee market, here is where you stand. You have more inventory than at any point in the last three to four years. You have negotiating leverage that didn’t exist during the pandemic market. And you have time — in most markets, the frantic pace of 2021 through 2023 has given way to a more measured, more rational process where you can conduct inspections, negotiate repairs, and make informed decisions without feeling like the house will be gone by tomorrow.
The trade-off is affordability. Rates above 6.3% mean your monthly payment is higher than it would have been in a lower-rate environment, even if the purchase price hasn’t changed. The question every buyer has to answer is whether today’s combination of better inventory, better negotiating position, and better terms outweighs the higher monthly cost of financing.
Our view is that for buyers who plan to own for five or more years, the current environment is favorable — particularly in Knox, Blount, Anderson, and Loudon counties where the fundamental demand drivers are strong. If rates decline in the future, you can refinance. What you can’t do is go back in time and buy at today’s prices if the market tightens.
What This Means If You’re Selling a Home in East Tennessee
If you’re a seller, the message depends heavily on where your property is located and how it’s priced. In Knox and Blount counties, well-priced homes are still selling within reasonable timeframes, and the pending sales data suggests that buyer activity is increasing heading into the spring. If you price correctly and present well, you’re in a solid position.
In the outer-ring counties, patience and pricing are even more critical. Anderson and Loudon counties have strong pending momentum, but Roane and especially Sevier counties require careful strategy. If you’re selling in Sevier County right now, you’re competing against a significant amount of inventory, and the only way to stand out is to be the best value in your price range.
Across the board, the sellers who are succeeding in this market share a few characteristics: they price based on current data rather than peak prices, they invest in presentation before listing, and they work with agents who understand the hyperlocal dynamics of their specific market. The sellers who struggle are the ones still anchored to 2022 expectations in a 2026 market.
Looking Ahead: April and May 2026
Based on the pending sales data, we expect April and May closings to improve across most of the six-county region. The pending-to-closing pipeline suggests that the spring market is gaining momentum, and if that momentum holds, we should see better year-over-year comparisons in the months ahead.
The unknowns are on the macro side. If geopolitical events push oil and inflation higher, that could keep rates elevated and dampen the spring surge. If the situation stabilizes and the Fed signals any movement toward rate cuts, buyer confidence could accelerate quickly. We’re watching both scenarios closely and will update the data every month.
Work With an Agent Who Knows the Numbers
At the end of the day, data doesn’t buy or sell houses — people do. But the people who make the best decisions are the ones working with the best information. Whether you’re buying your first home in Knoxville, selling a property in Blount County, investing in Loudon County, or trying to make sense of the Sevier County market, we’re here to help you understand what the numbers mean for your specific situation.
If you found this market update helpful, subscribe to our monthly updates so you never miss the latest data. And if you’re ready to have a conversation about buying or selling in East Tennessee, reach out to our team today. No pressure, no obligation — just honest, data-driven guidance from people who live and breathe this market every day.
Troy Stavros, CornerStone Realty Associates – 865-999-0925 – Troy@865realestate.com