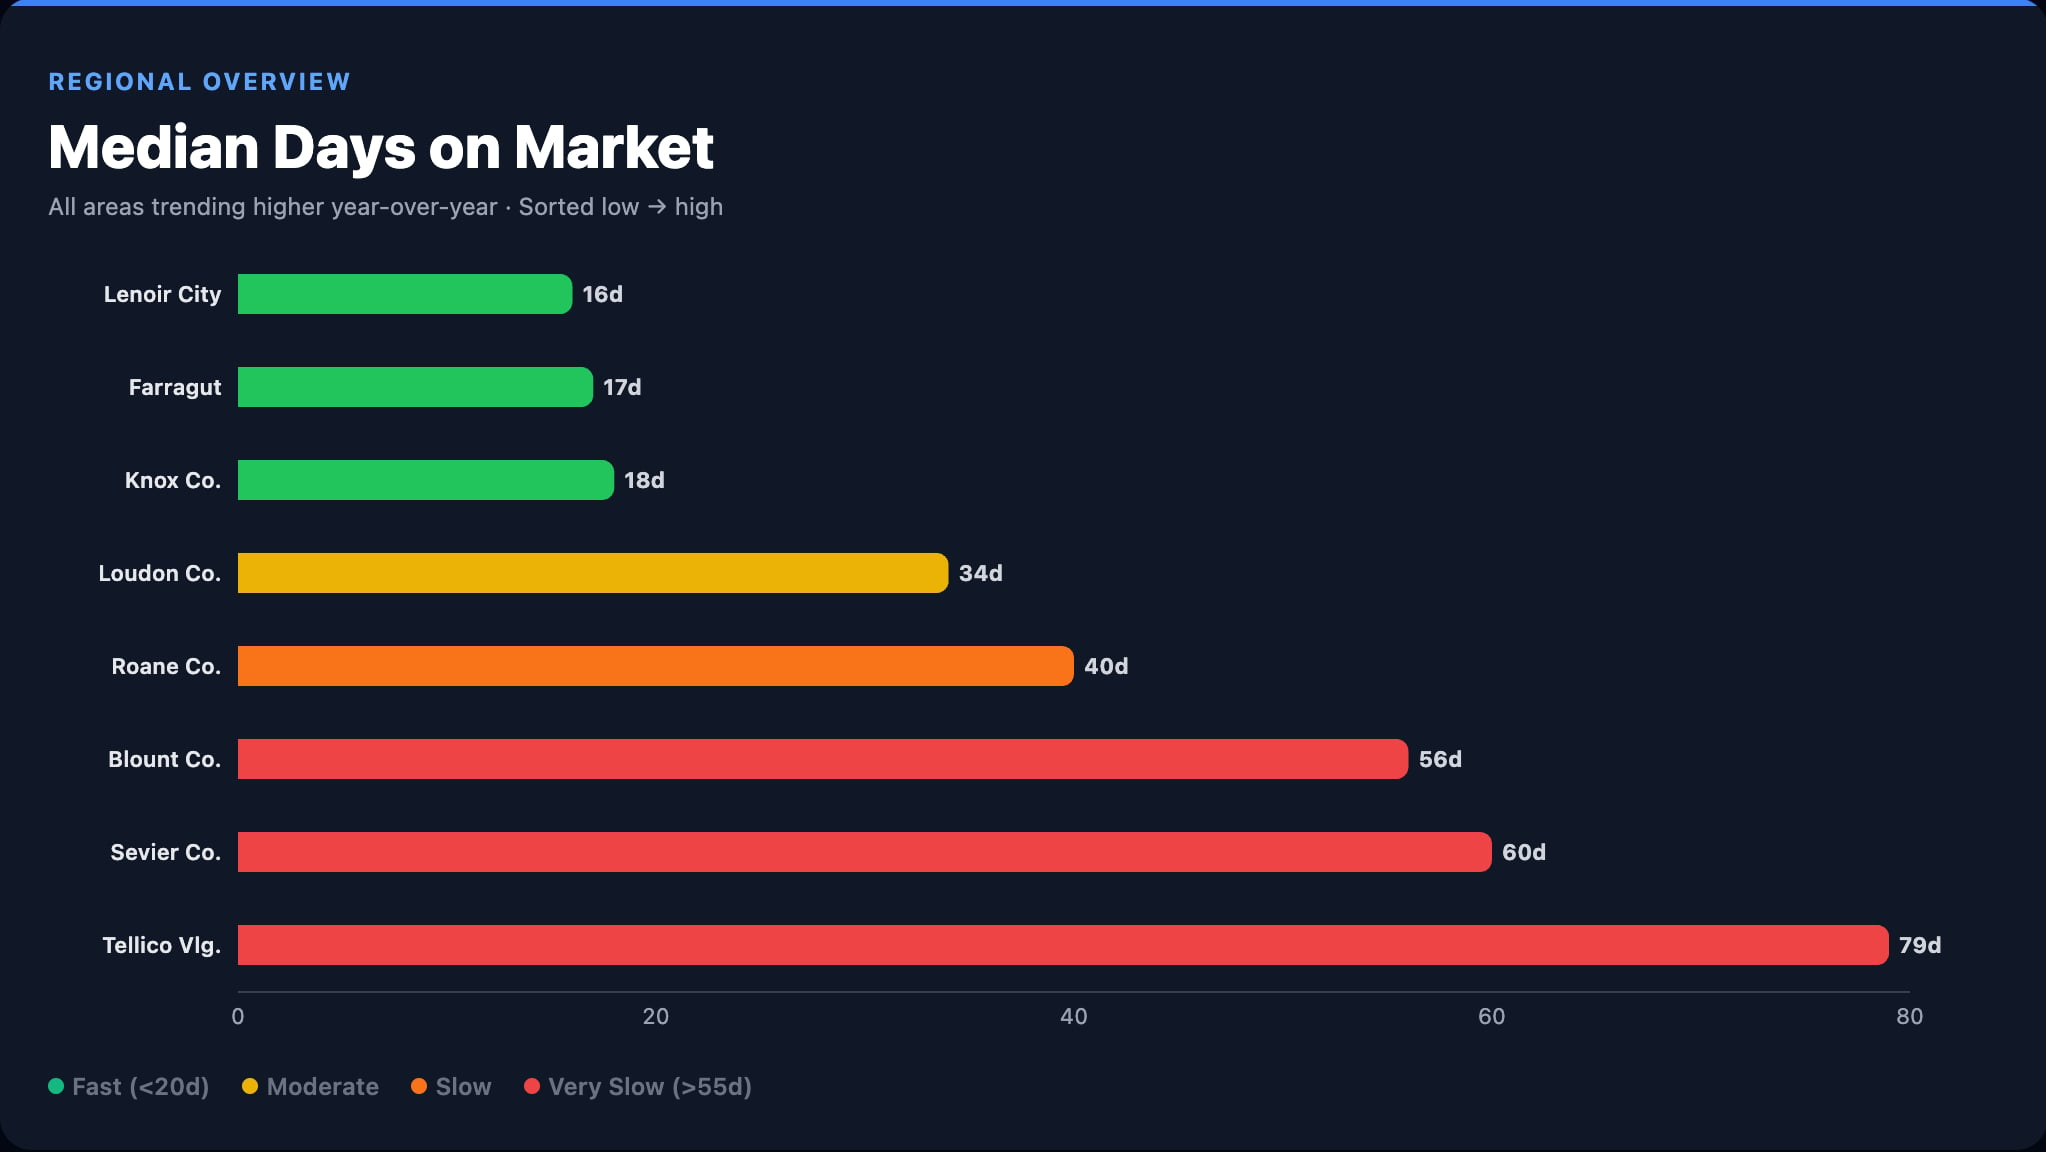
Every East Tennessee Market Posted Gains in June — Here’s What the Data Says
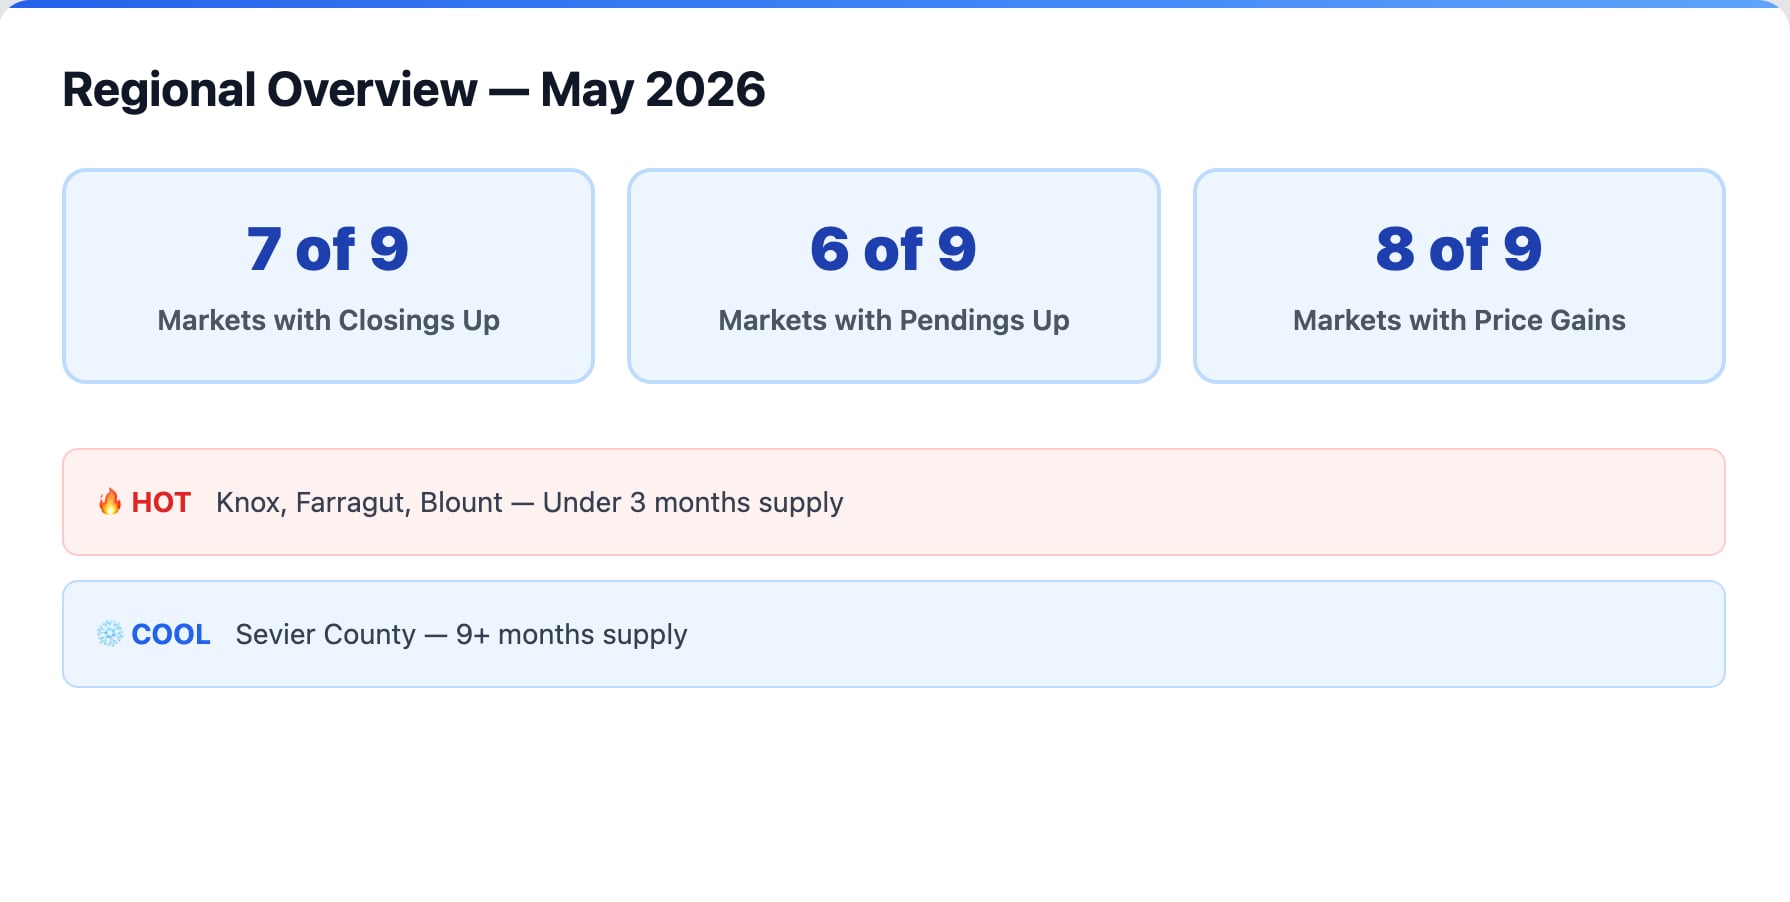
The June 2026 numbers are in, and the story they tell might surprise you. Despite mortgage rates hovering near 7%, every single market I track across East Tennessee posted year-over-year closings gains last month. Farragut surged 52.5%. Anderson County climbed 24.7%. Even Sevier County — the region’s softest market — grew 21.3%.
Buyers have adapted. They’re making decisions based on need, life circumstances, and local value rather than waiting for a rate cut that, frankly, isn’t coming this year. But understanding what’s happening nationally is essential to understanding where our local markets are headed, so let’s start there.
What the June CPI Report Means for East Tennessee Home Buyers and Sellers
The June Consumer Price Index landed this week, and the headline number grabbed attention. CPI came in at 3.5% year over year, but the monthly reading of -0.4% on a seasonally adjusted basis marked the sharpest single-month decline since April 2020. Energy drove the drop — overall energy costs fell 5.7% month over month, and gasoline prices specifically declined 9.7%.
However, the number that matters most for the housing market told a different story. Core CPI, which strips out volatile food and energy prices, held steady at 2.6% year over year and was completely flat month over month. The sticky, services-driven inflation that the Federal Reserve watches most closely barely budged. That distinction is critical for anyone trying to time a home purchase around falling interest rates.
The Federal Reserve’s Message Is Clear: No Rate Cuts in 2026
Newly appointed Federal Reserve Chairman Kevin Warsh testified before Congress on the morning of the CPI release and left no room for ambiguity. He stated the committee has “no tolerance for persistently elevated inflation” and remains committed to the 2% target. He went further, saying policymakers “need to choose lower prices,” signaling the Fed will keep financial conditions tight as long as necessary.
The June CPI print did accomplish one thing: it effectively closed the door on a rate hike at the July 29th FOMC meeting. The CME FedWatch Tool now shows an 86% probability that the Fed holds rates steady, and the pressure from committee members who had been projected to support raising rates later this year has dissipated.
But no one expects rate cuts in 2026. The Fed wants to see sustained declines in core inflation before they’ll even consider easing. For buyers and sellers in East Tennessee, the takeaway is straightforward — rates near 7% are the operating reality, not a temporary condition. Planning around that reality is far more productive than waiting for it to change.
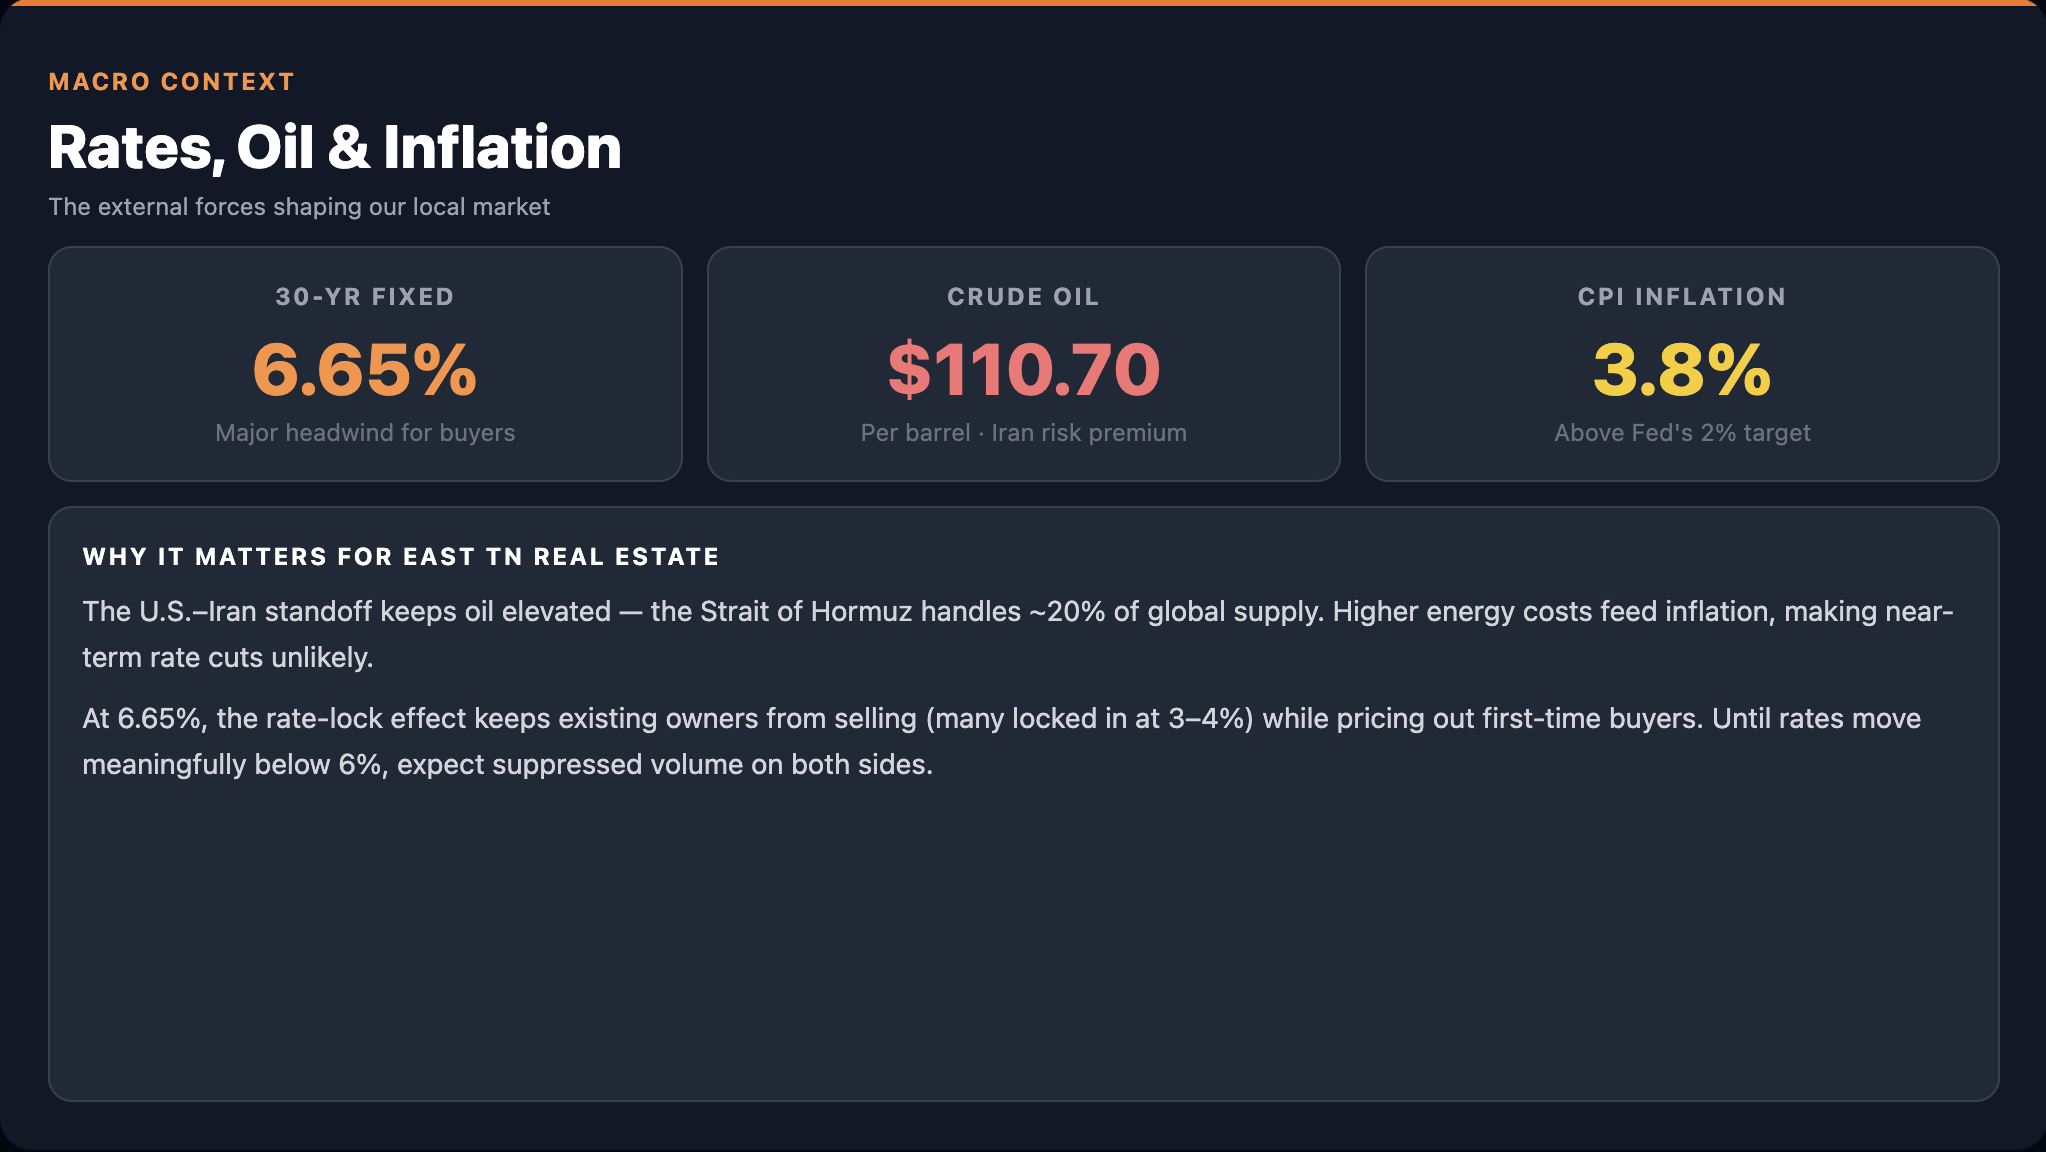
Oil Prices and the Strait of Hormuz: The Wildcard for Housing
The variable that could upend everything is oil. Brent crude surged nearly 10% in a single session after the United States reinstated a naval blockade of Iranian vessels and both nations escalated military actions near the Strait of Hormuz, one of the most critical shipping lanes in the world. As of mid-July, Brent is trading at $85.78 per barrel and continuing to climb.
This matters for East Tennessee real estate in 2 important ways. First, if oil sustains above $90 a barrel, gasoline prices reverse course and the CPI relief we just discussed evaporates. The rate-hike conversation comes back to the table. Second, higher oil prices directly increase construction costs through lumber transportation, material delivery, and equipment fuel, constraining new housing supply at exactly the time the region needs more of it. This is the exogenous variable every buyer and seller should be watching over the next 60 days.
Current Mortgage Rates and What to Expect Through Year End
The 30-year fixed mortgage rate sat at 6.64% on Friday, jumped to 6.72% on Monday, and settled at 6.70% on Tuesday. It was a modest move, but the trajectory is informative. Expect mortgage rates to trade in a band between 6.4% and 7.1% through the end of 2026. This is the environment we’re operating in, and the East Tennessee markets are proving they can perform within it.
Knox County Housing Market Update
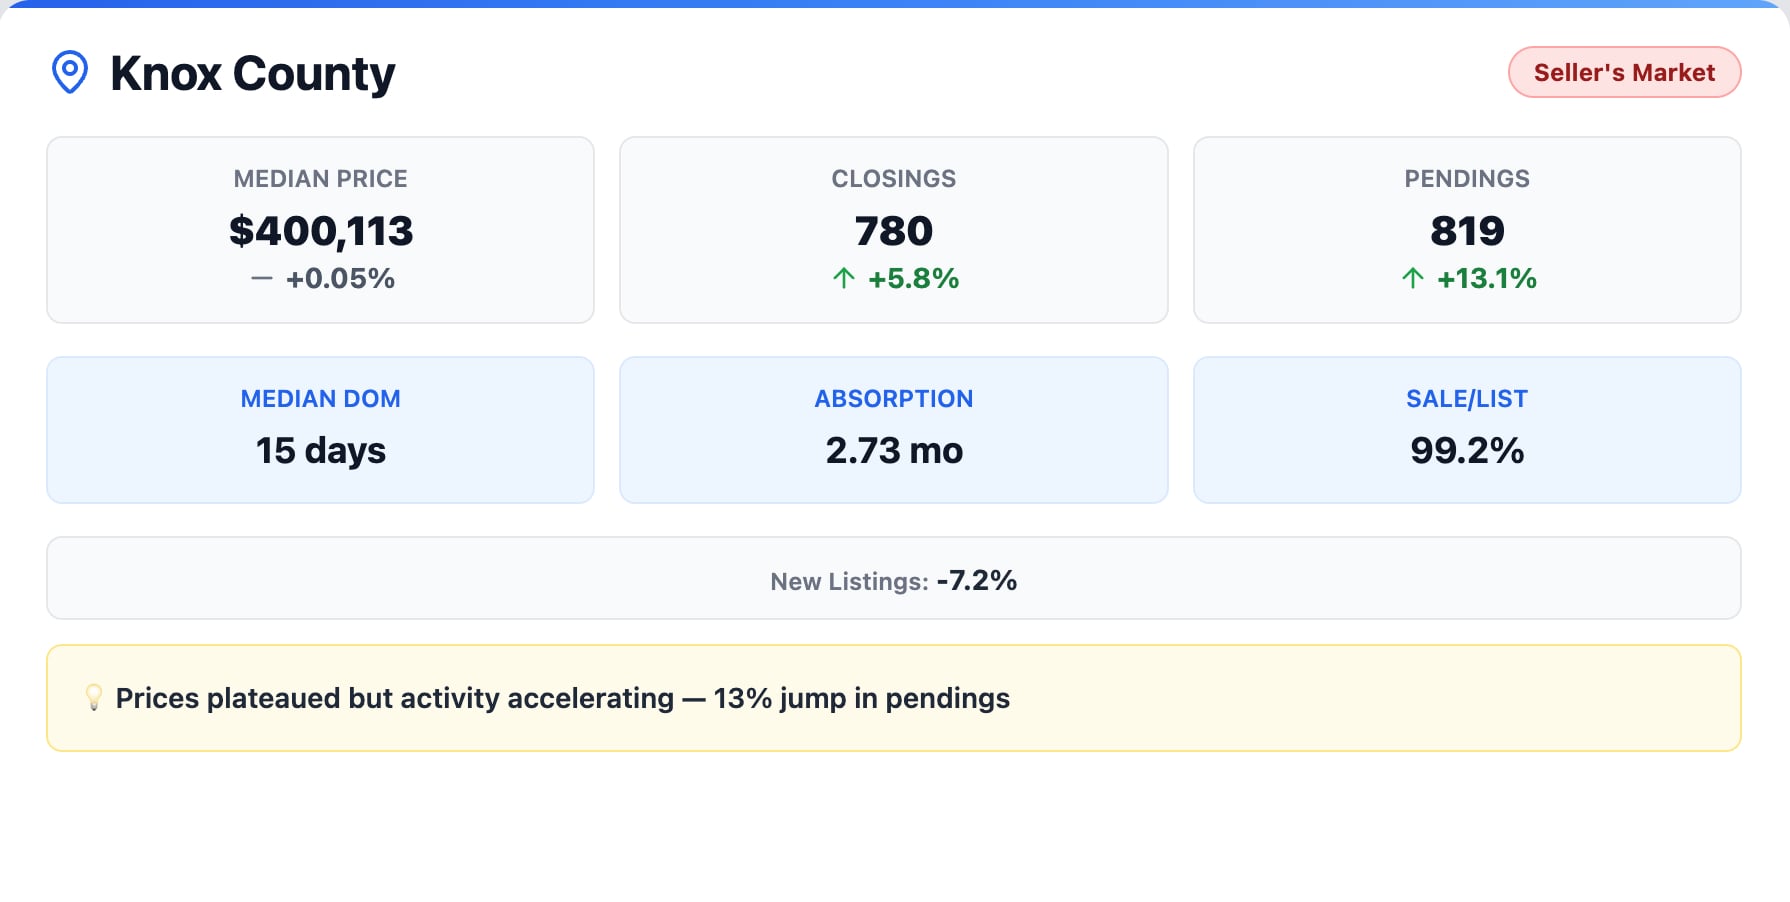
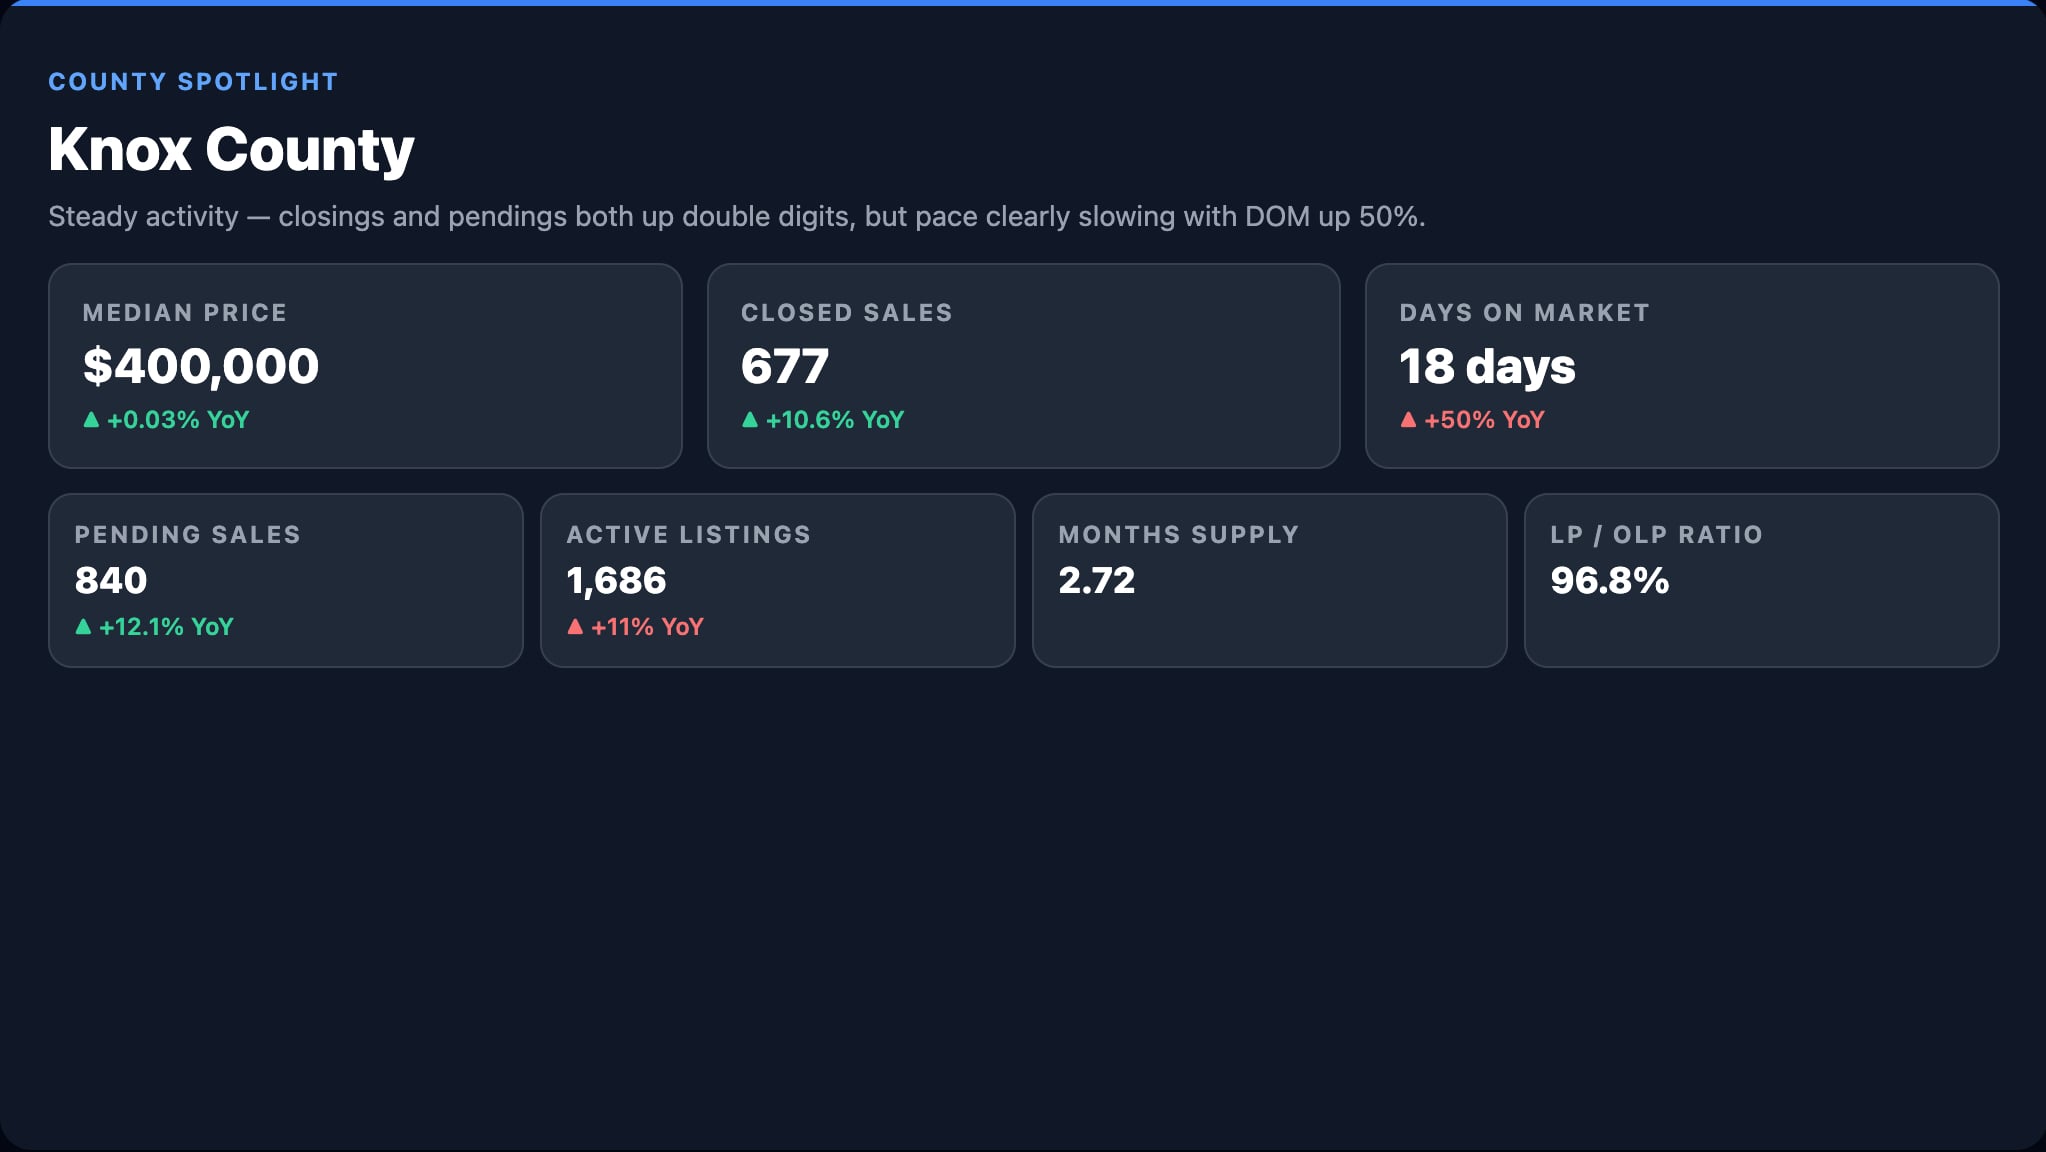
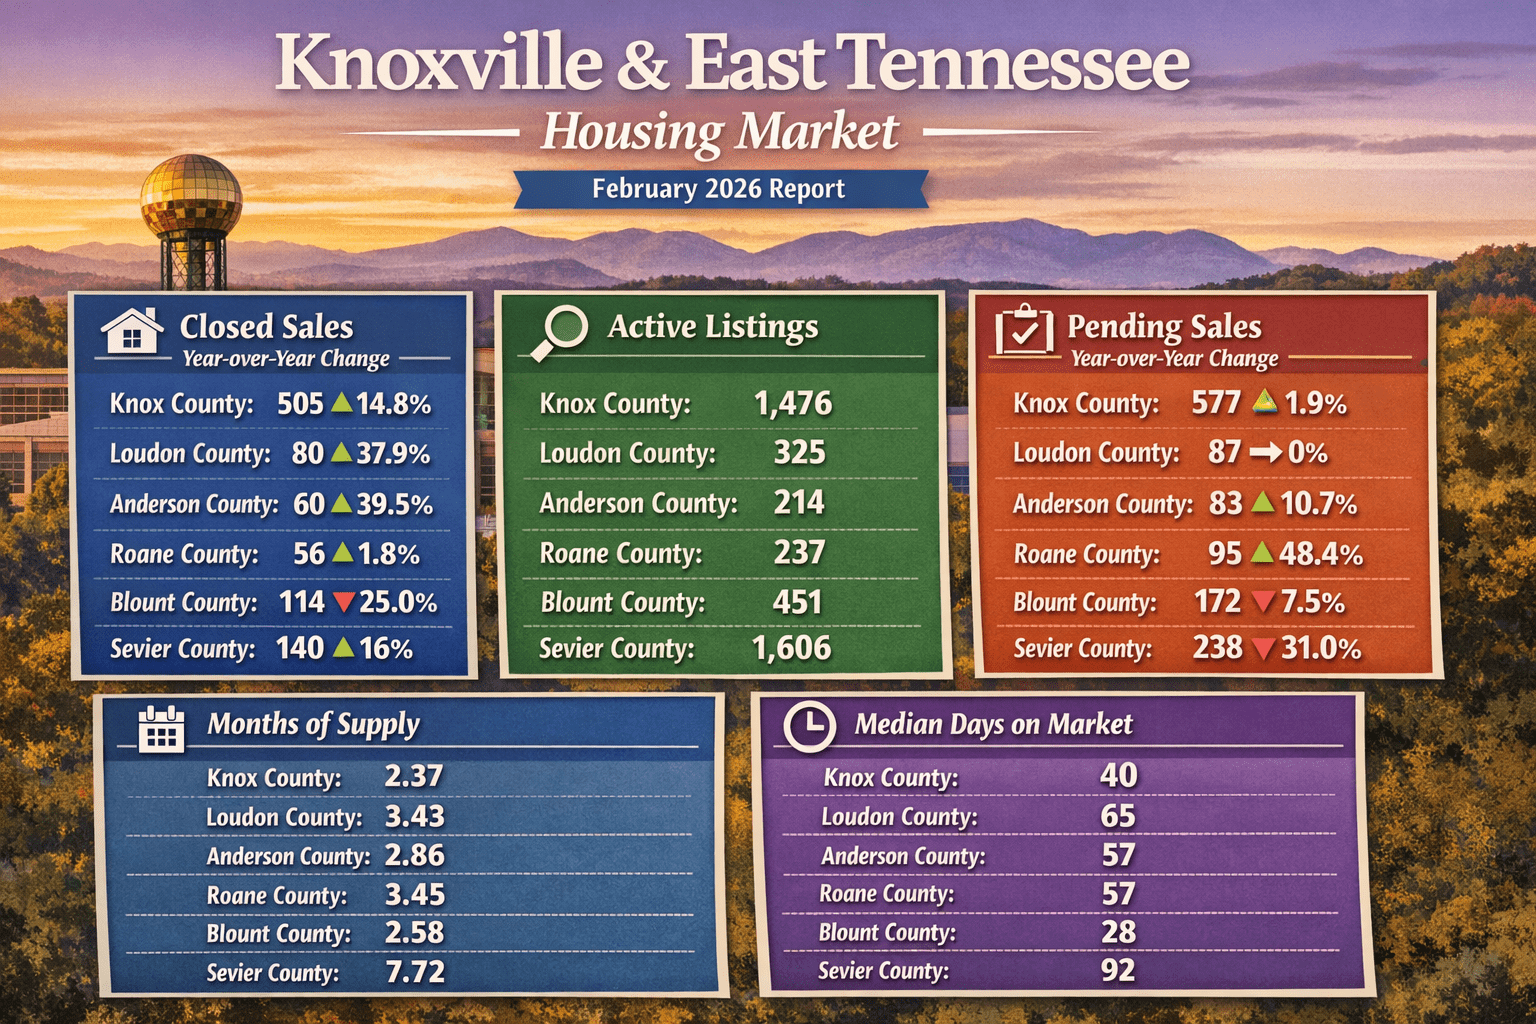
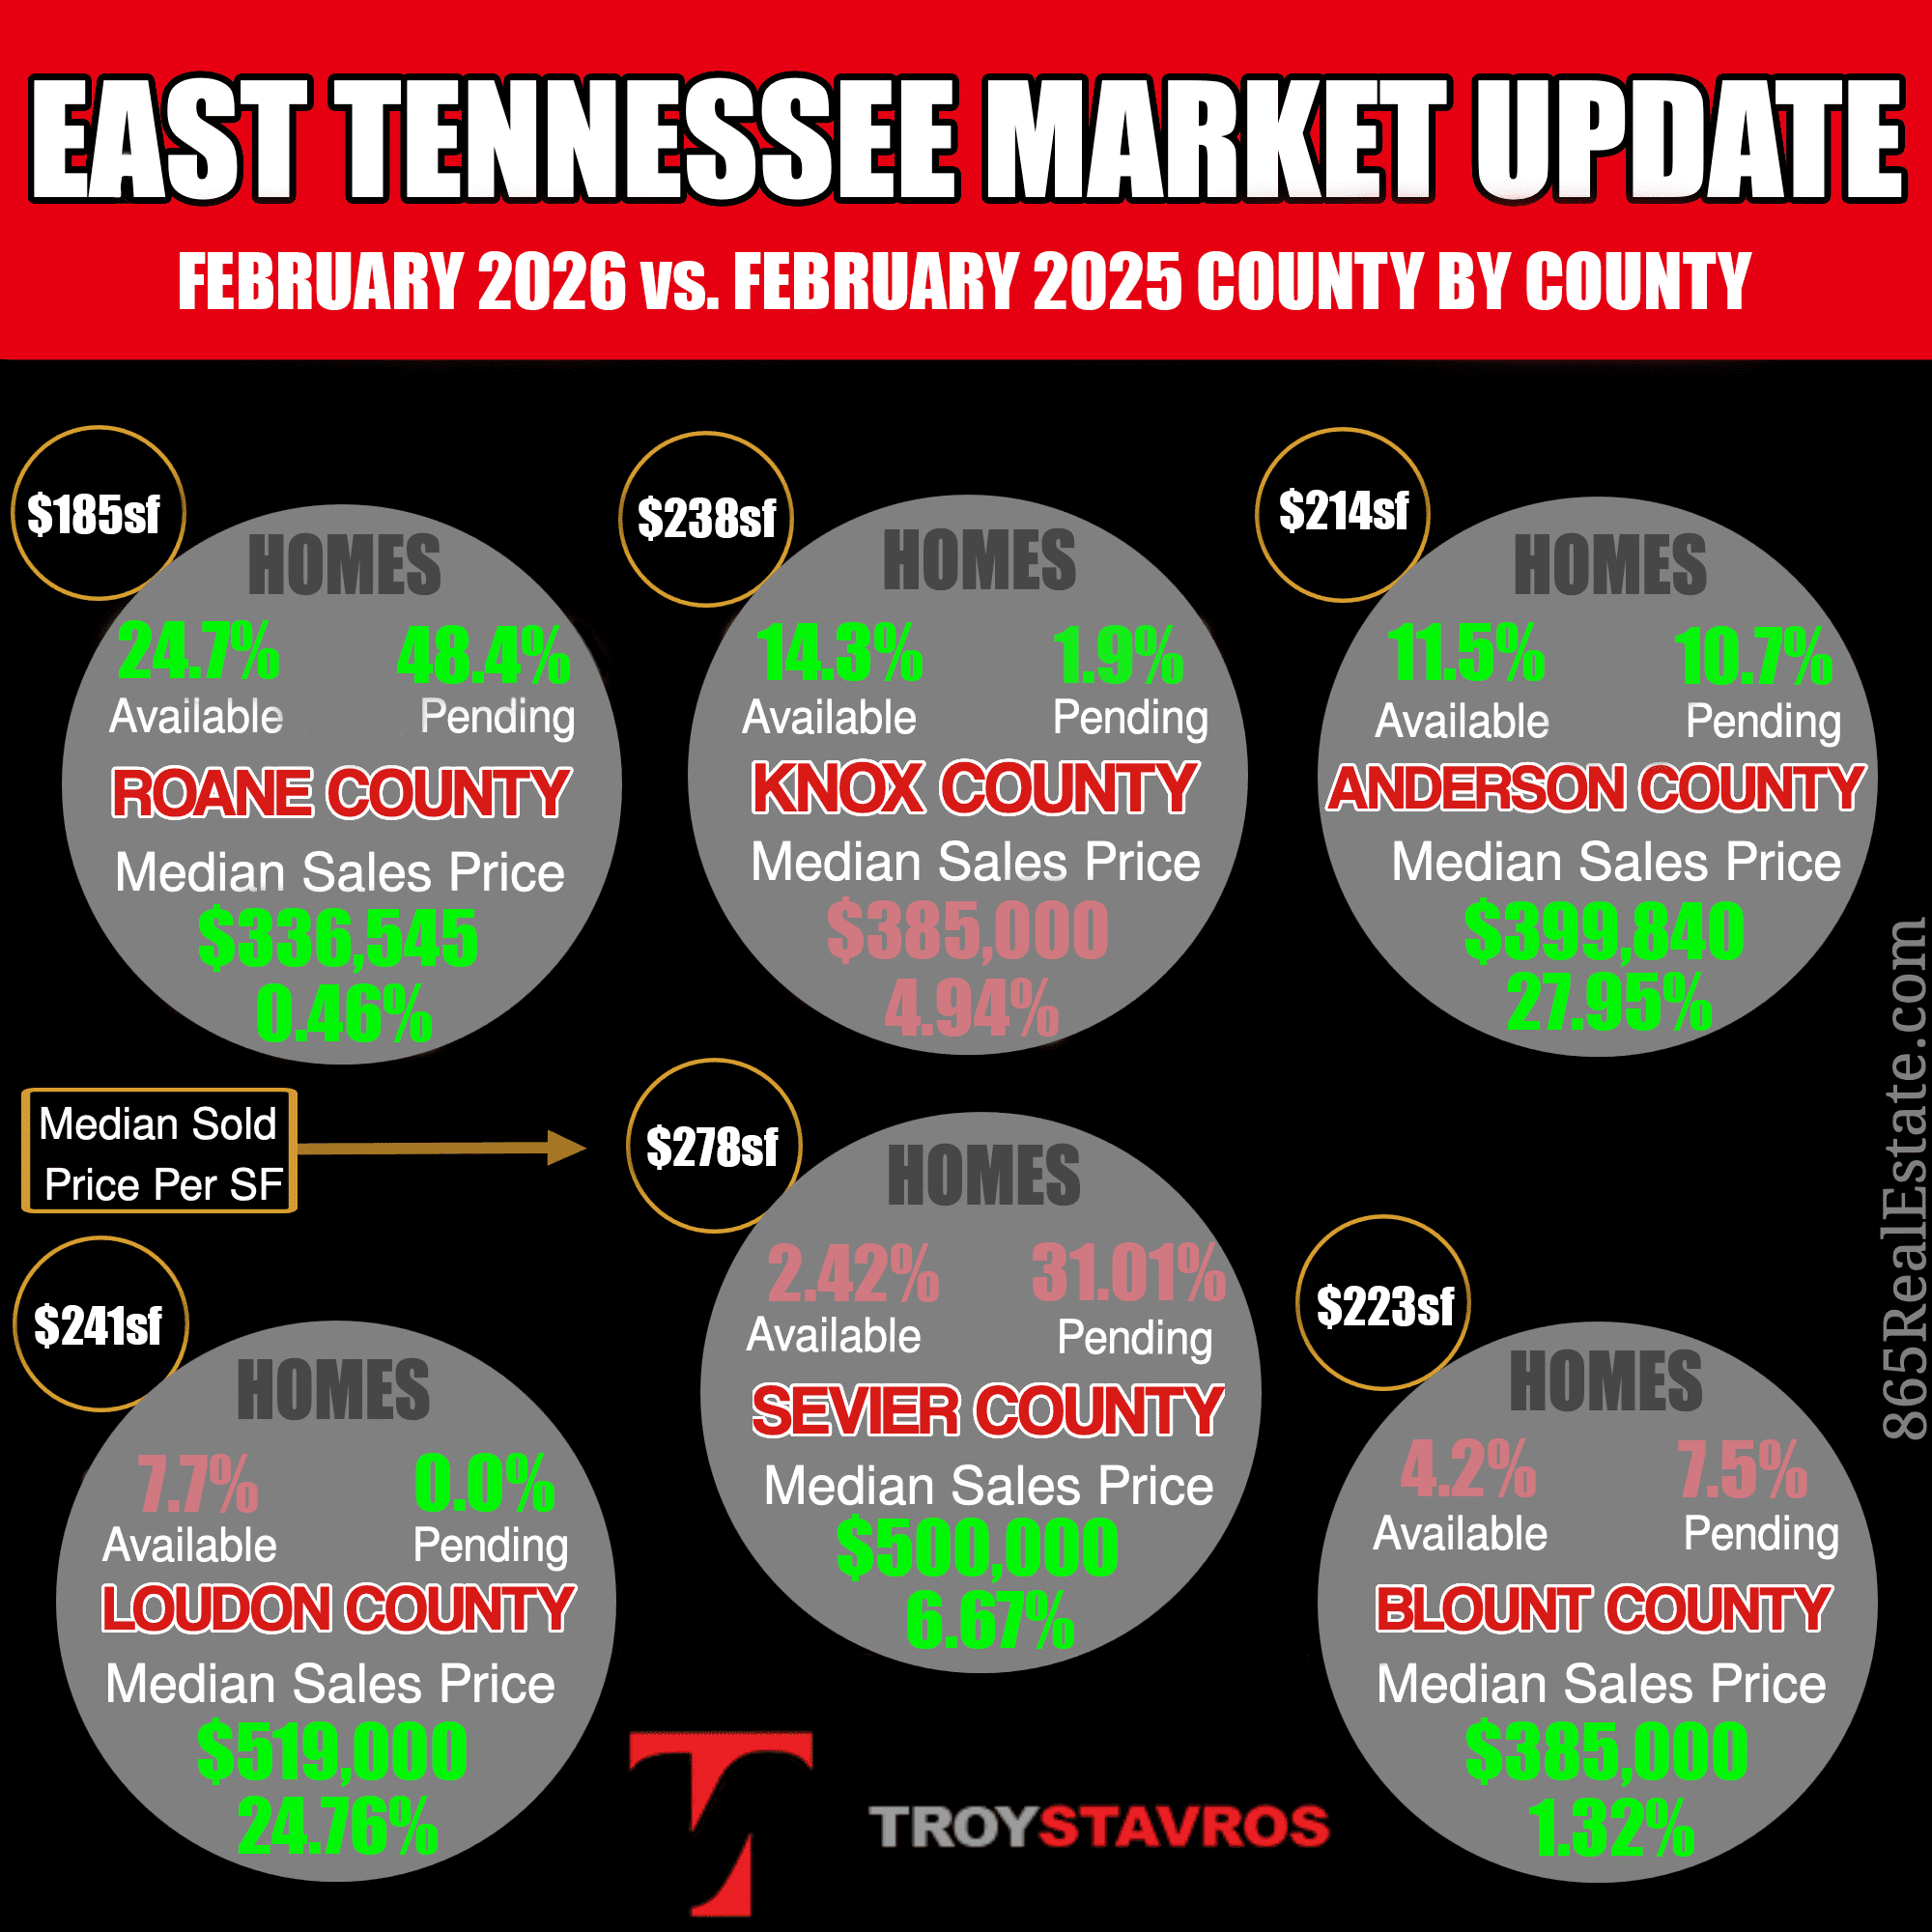
Knox County remains the anchor market for the region. June closings rose 7.9% year over year, and year-to-date closings are tracking above 2025 levels. The median home price in Knox County is sitting in the low $400s and has been essentially flat year over year. This is a market where the constraint is inventory, not demand. Buyers are active and engaged, but sellers remain locked in by the rate gap between their current mortgage and what they’d pay on a new home.
Looking ahead, Knox County is on track to finish 2026 with total closings in the range of 7,800–8,200 units, representing a 5–10% increase over last year. Median prices should remain stable in the low $400K range. Any loosening in the lock-in effect, even modest, would unlock significant additional transaction volume. If you’re considering selling a home in Knox County, the demand is there — pricing it right is the key to capturing it.
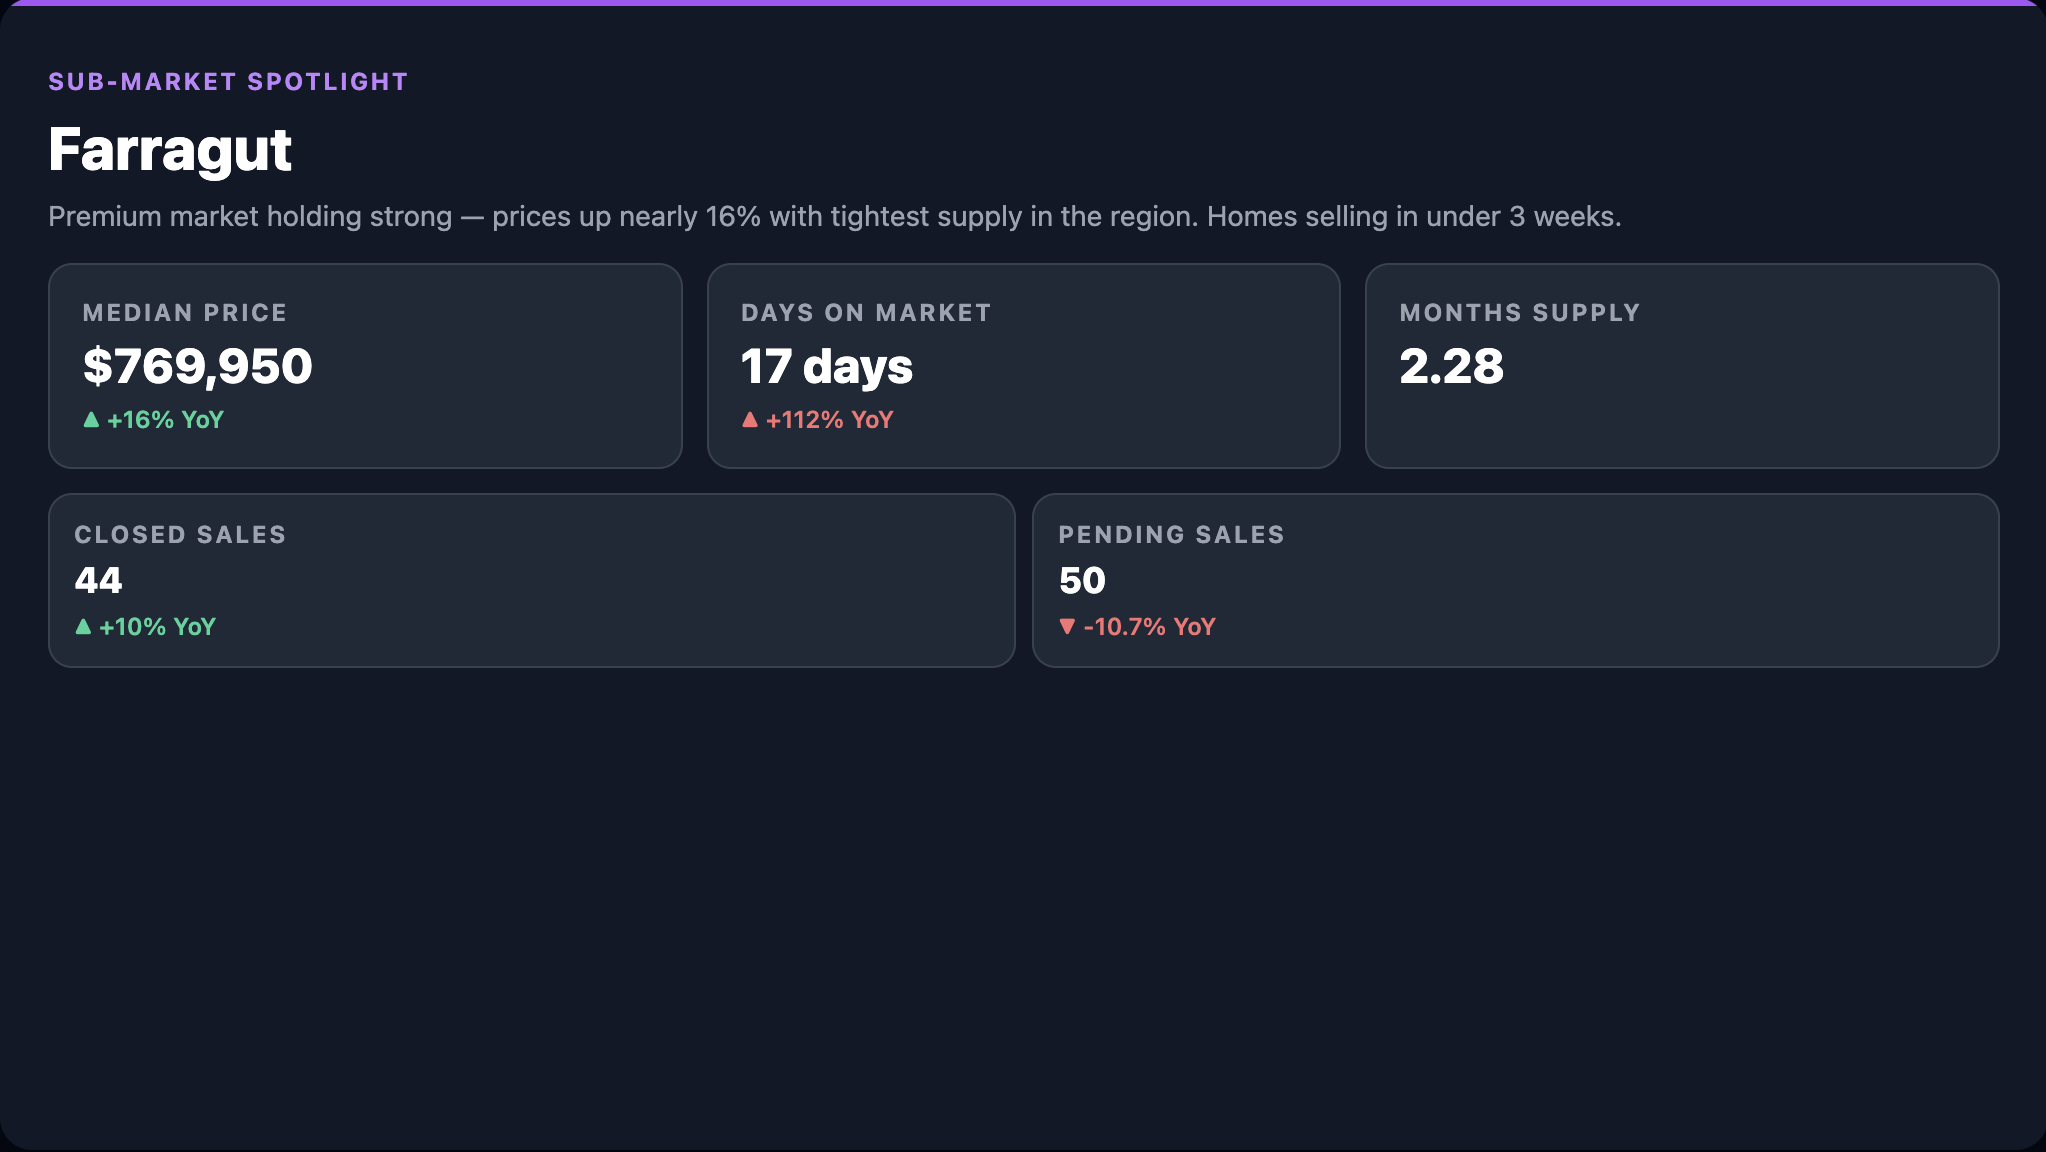
Farragut Real Estate Market Update
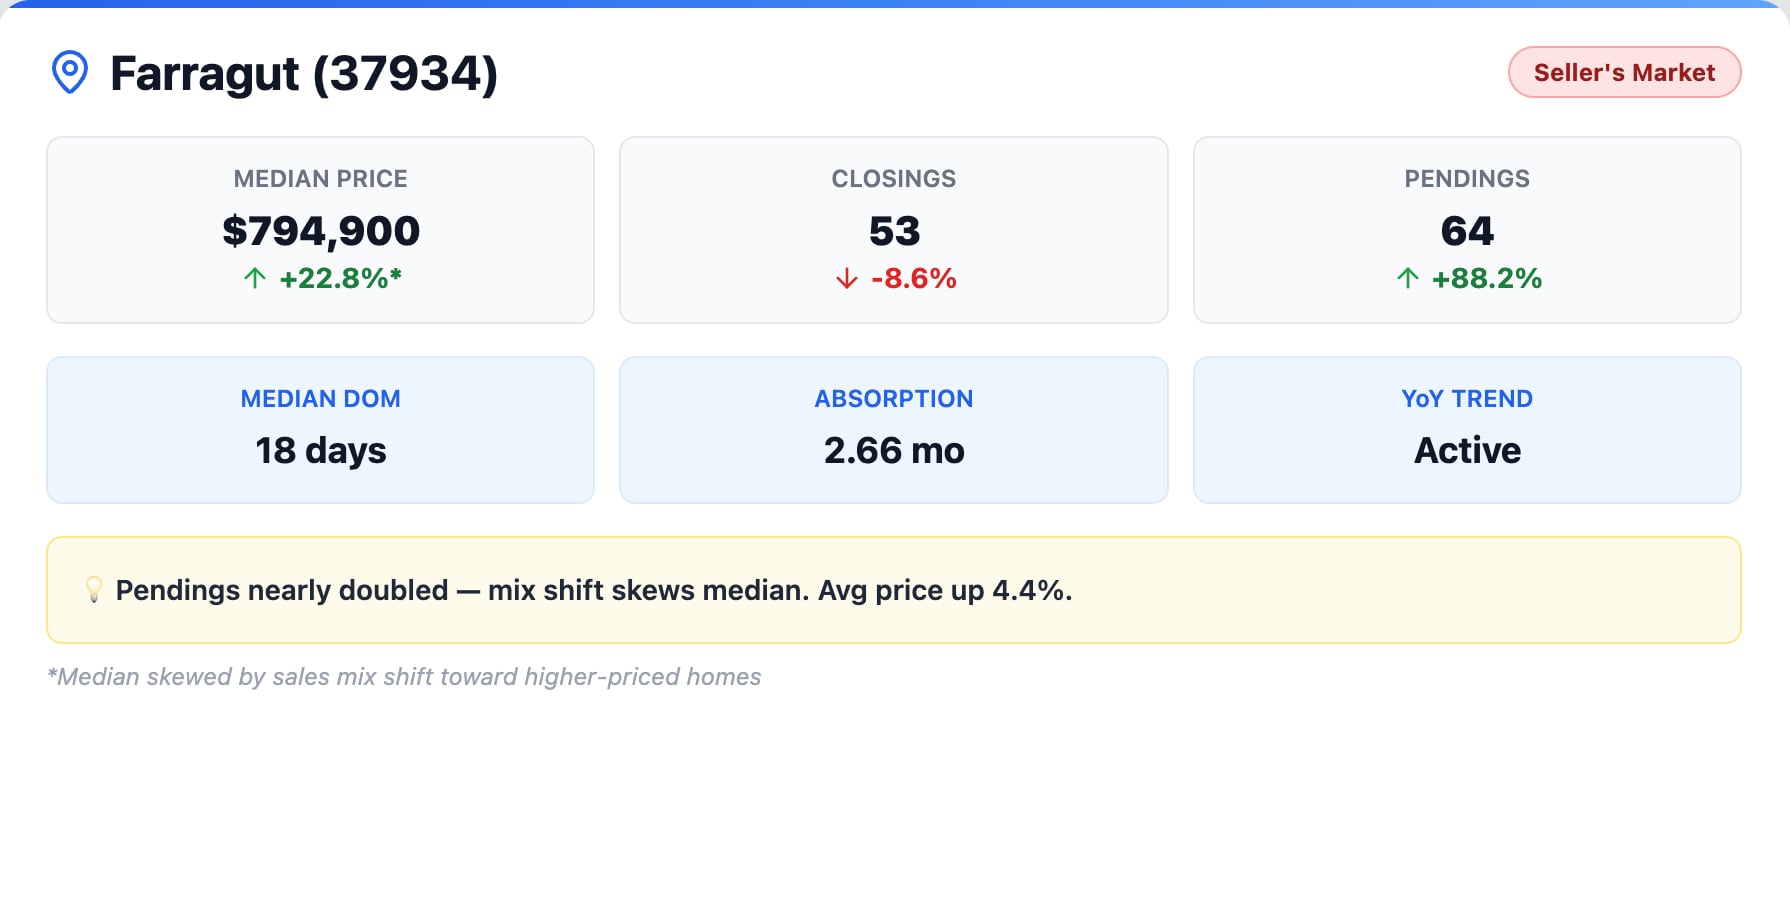
Farragut is the most competitive market in East Tennessee right now, and the June data confirms it emphatically. Closings surged 52.5% year over year. The year-to-date absorption rate sits at just 2.44 months, firmly in strong seller’s market territory. Inventory is declining, and the combination of top-rated schools, premium amenities, and an unmatched lifestyle continues to drive outsized demand.
If current trends hold, expect the median home price in Farragut to push toward $800K by Q4. Buyers shopping for homes in Farragut should be prepared for multiple-offer scenarios on well-priced properties through the summer and into fall. This is not a market where a wait-and-see approach is working in your favor. Sellers, meanwhile, hold significant leverage — but overpricing still carries risk even in a market this tight.
Blount County Housing Market Update
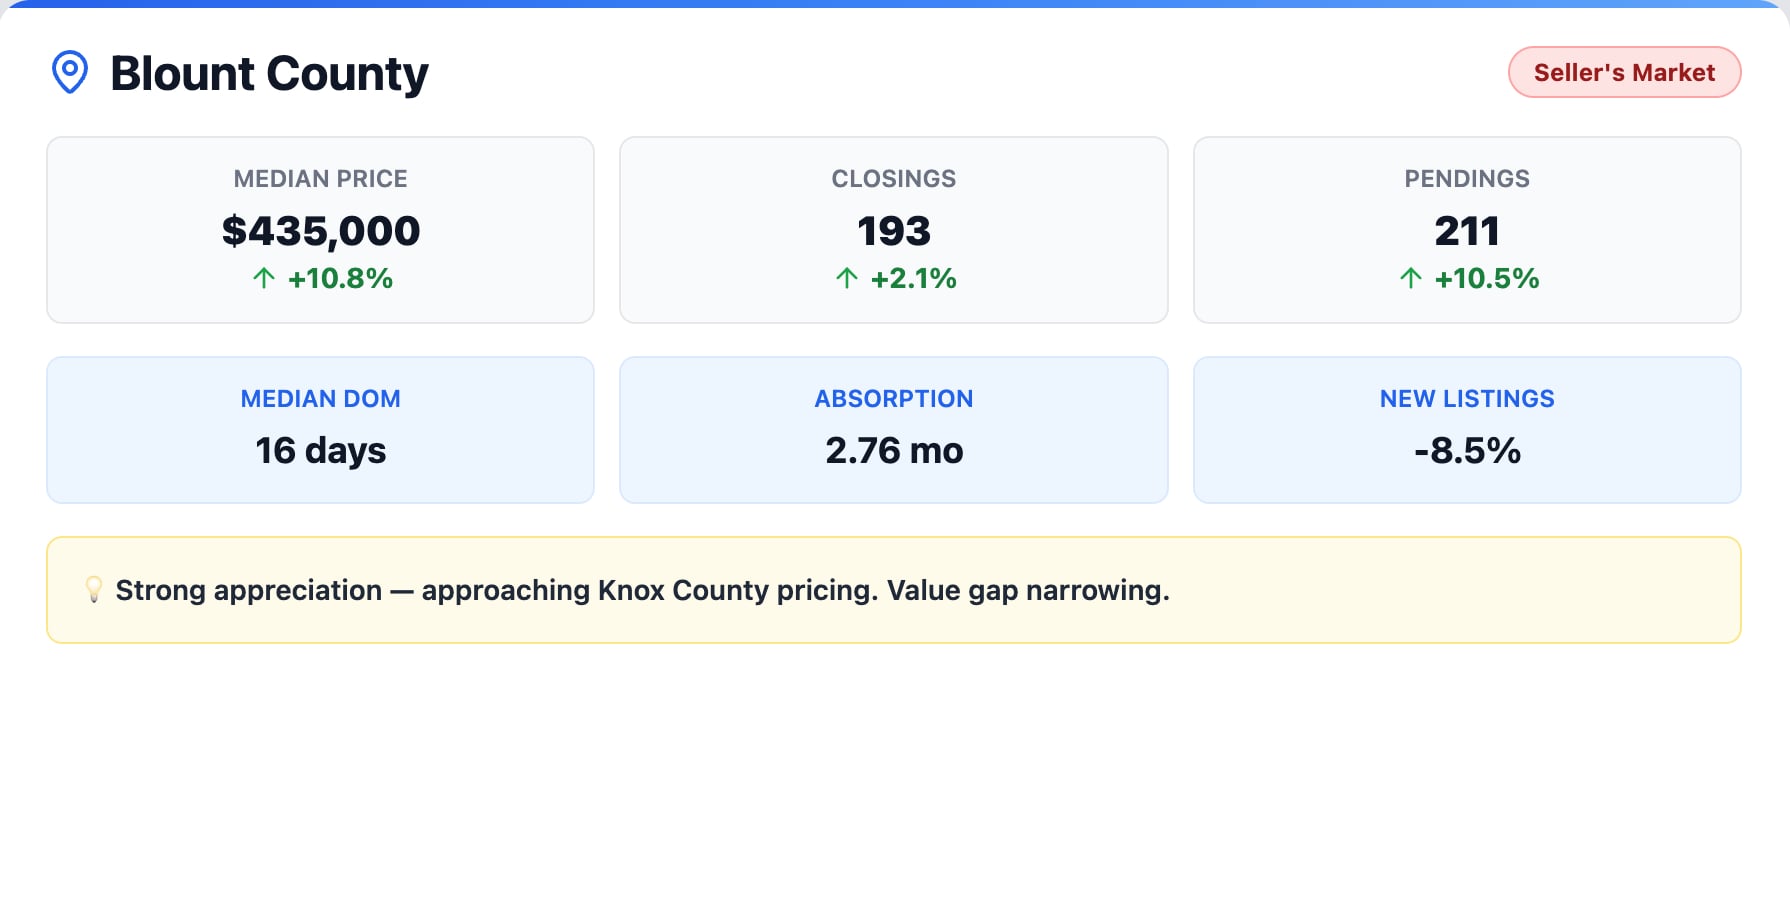
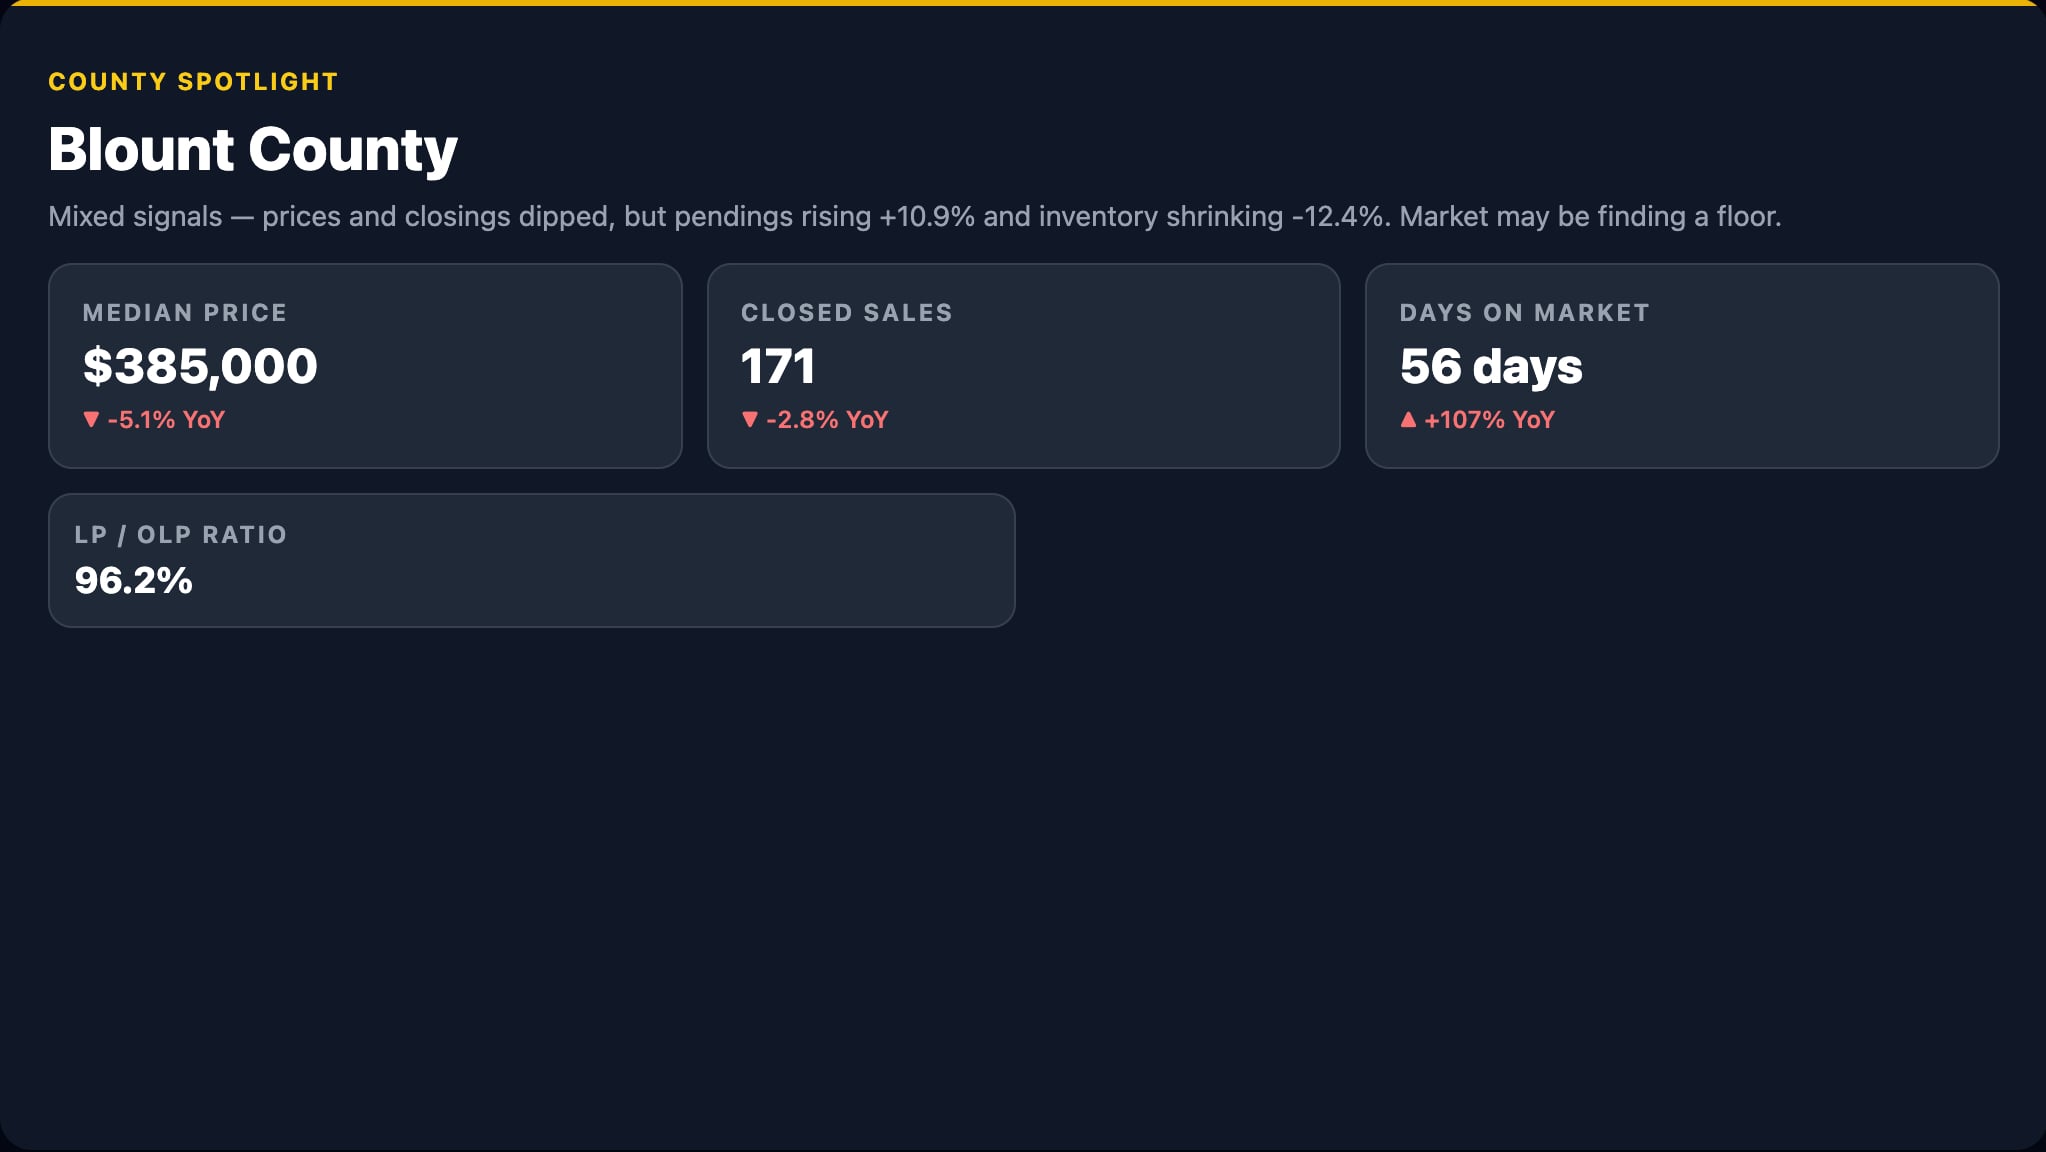
Blount County continues its pricing convergence with Knox County. The median home price has settled into the $400K–$430K range, and the absorption rate is trending below 2.75 months, pushing Blount County into tight seller’s market territory that’s beginning to resemble Farragut’s competitive dynamics.
The county’s appeal as a Smoky Mountains-adjacent market offering real value compared to Sevier County continues to attract both primary-residence buyers and investors. If the absorption rate drops below 2.5 months, we’re looking at a pricing environment that strongly favors sellers through year end. Blount County is a market where the window for buyers to find relative value is narrowing, and it’s worth paying close attention to over the coming months.
Anderson County Real Estate: The Region’s Best Value
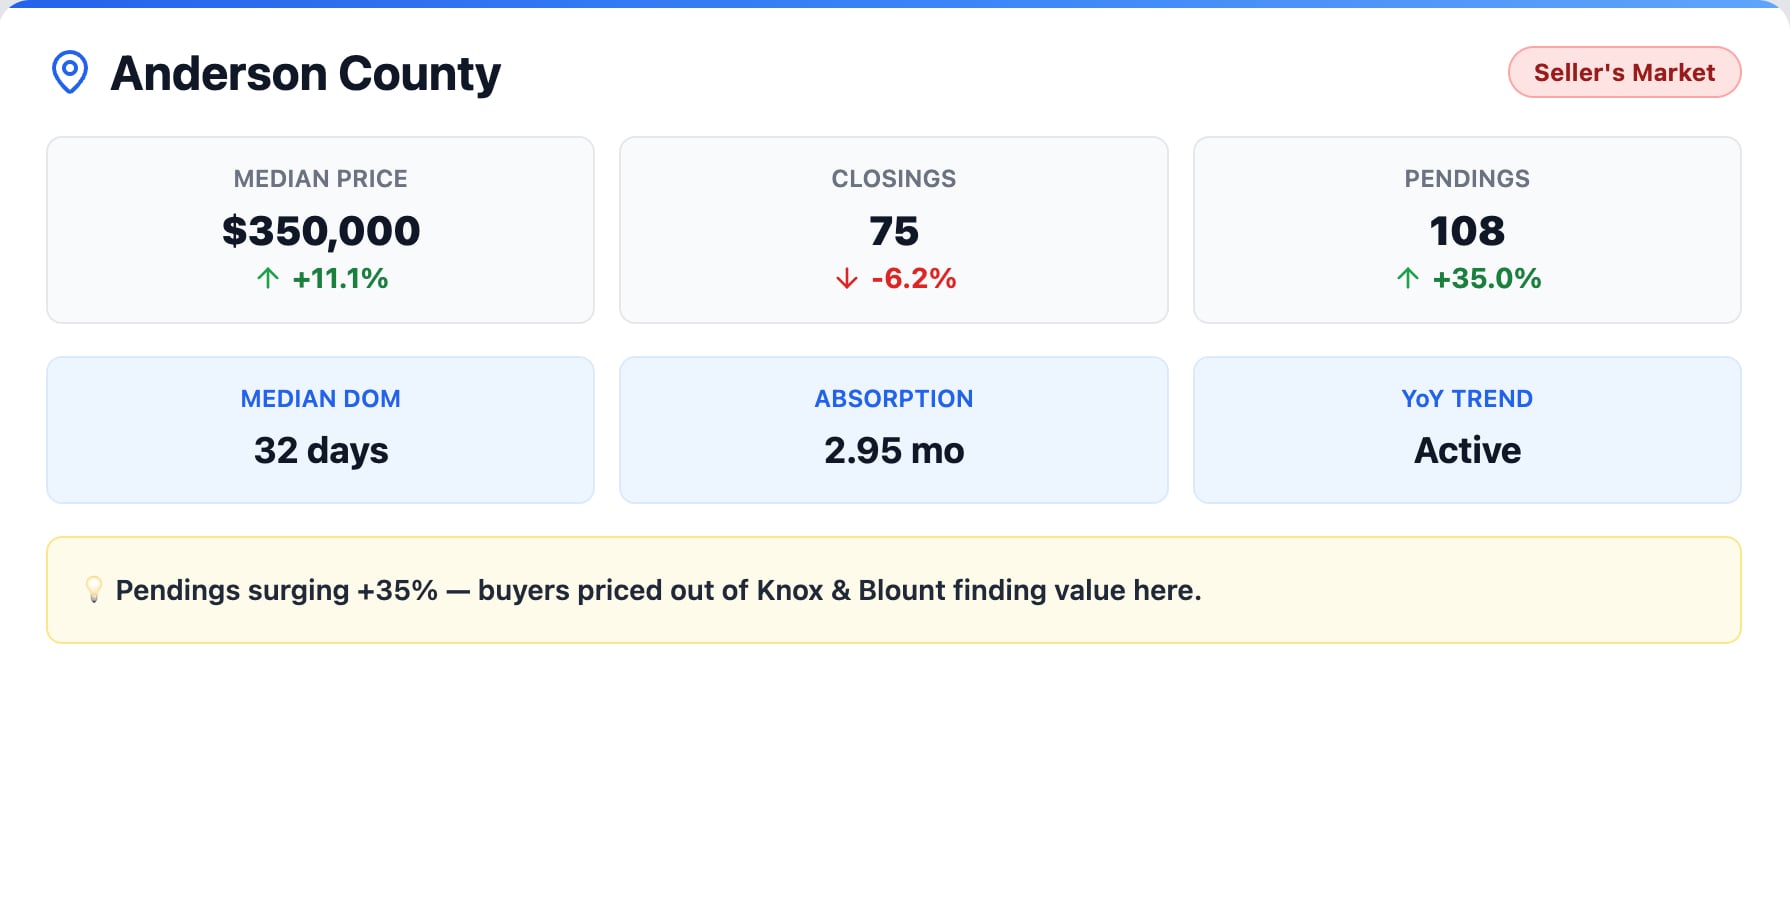
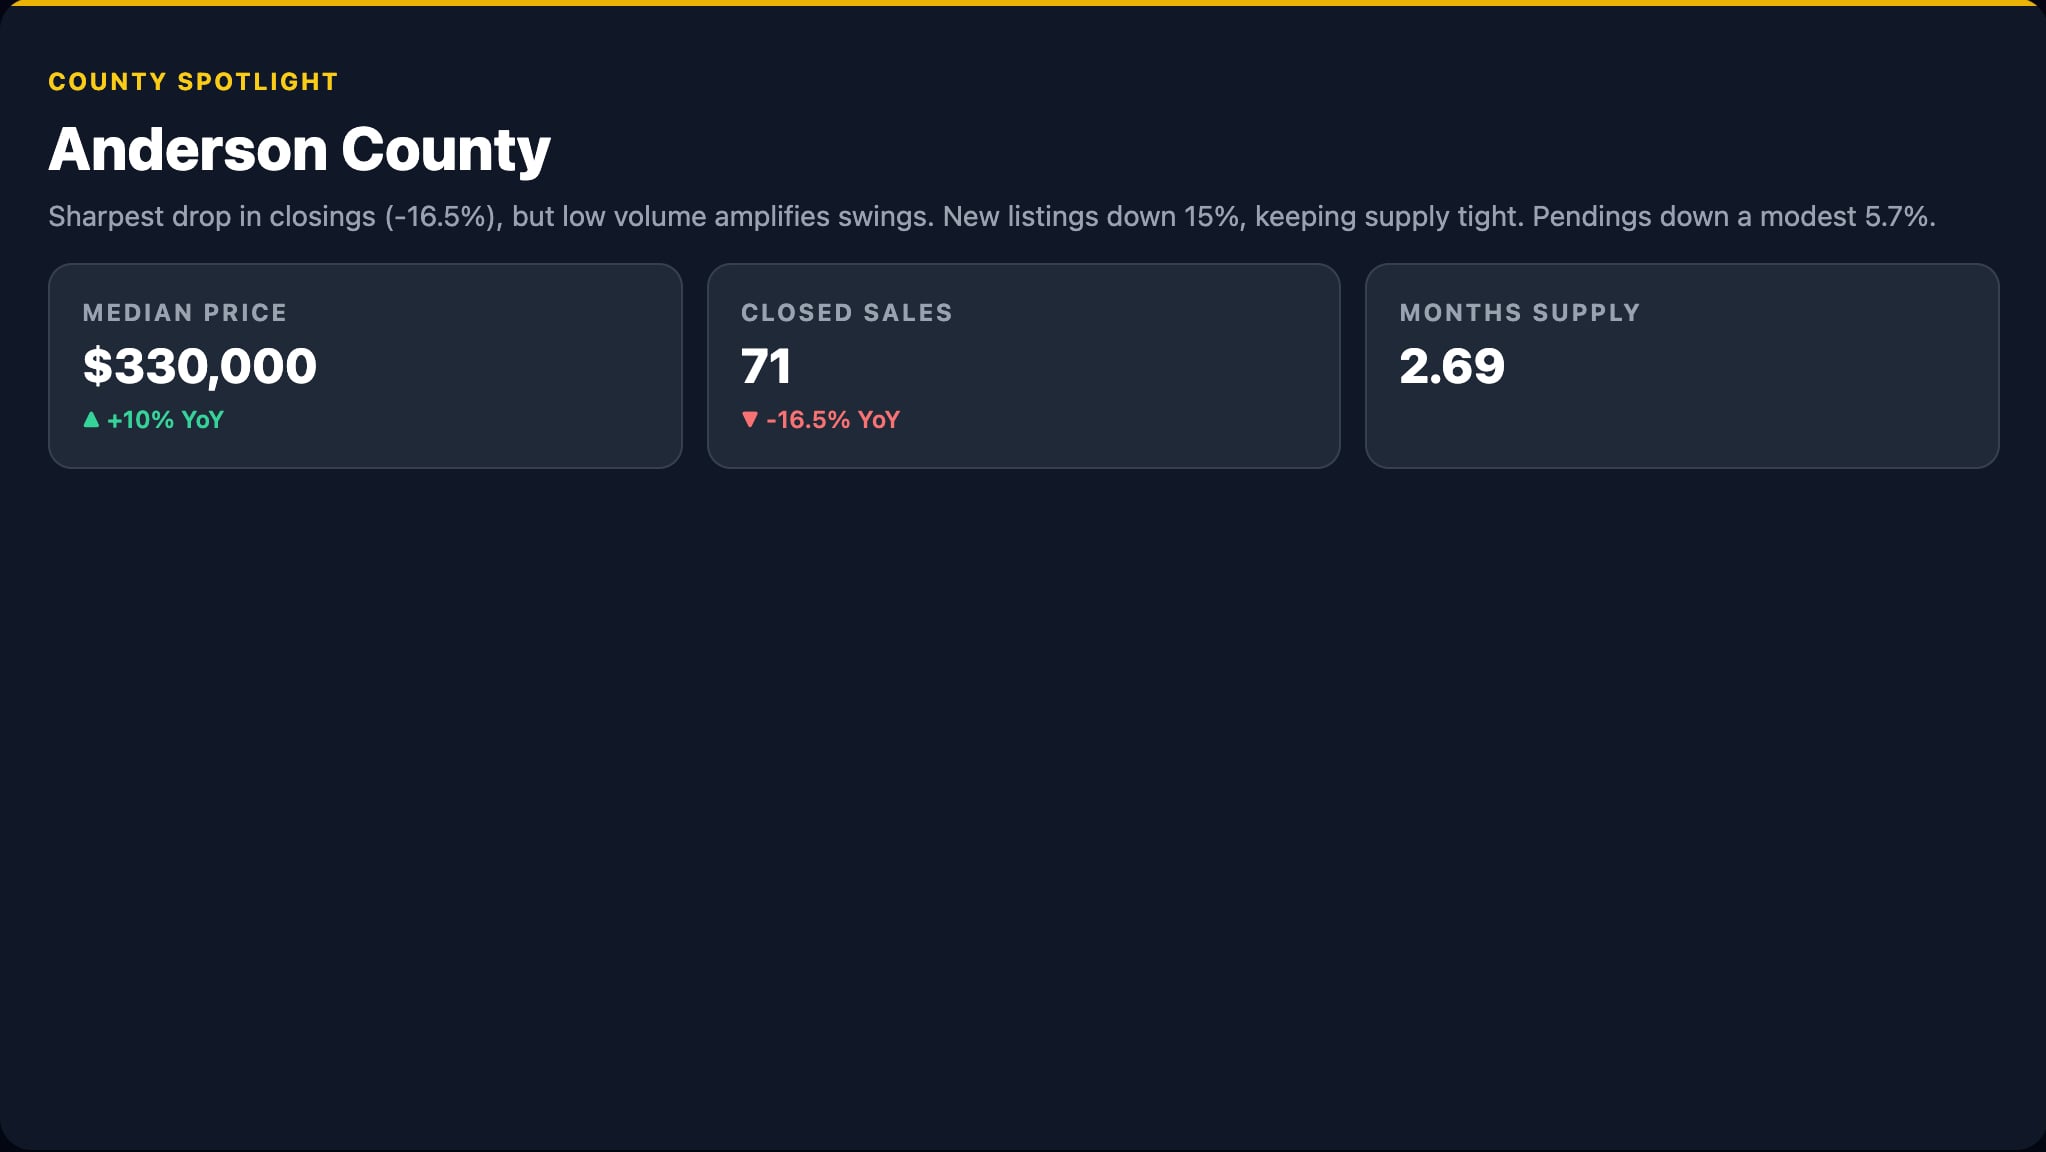
Anderson County is the best value story in East Tennessee, and June painted a compelling picture. Closings jumped 24.7% year over year, and new listings surged 33.3%, the strongest listing growth in the entire region. At a median home price of $377,000, Anderson County is the most accessible market in this report.
What makes Anderson County particularly interesting right now is that the supply increase is being met with proportional demand growth. Prices aren’t falling — they’re stabilizing. If listing growth continues while demand holds, the absorption rate could drift toward 3.5 months, giving buyers a slightly more balanced negotiating environment. The median should finish the year somewhere between $370K and $390K. For buyers who are feeling priced out of Knox County or Blount County, Anderson County deserves serious consideration. The market fundamentals are strong, the value is real, and the trajectory is encouraging.
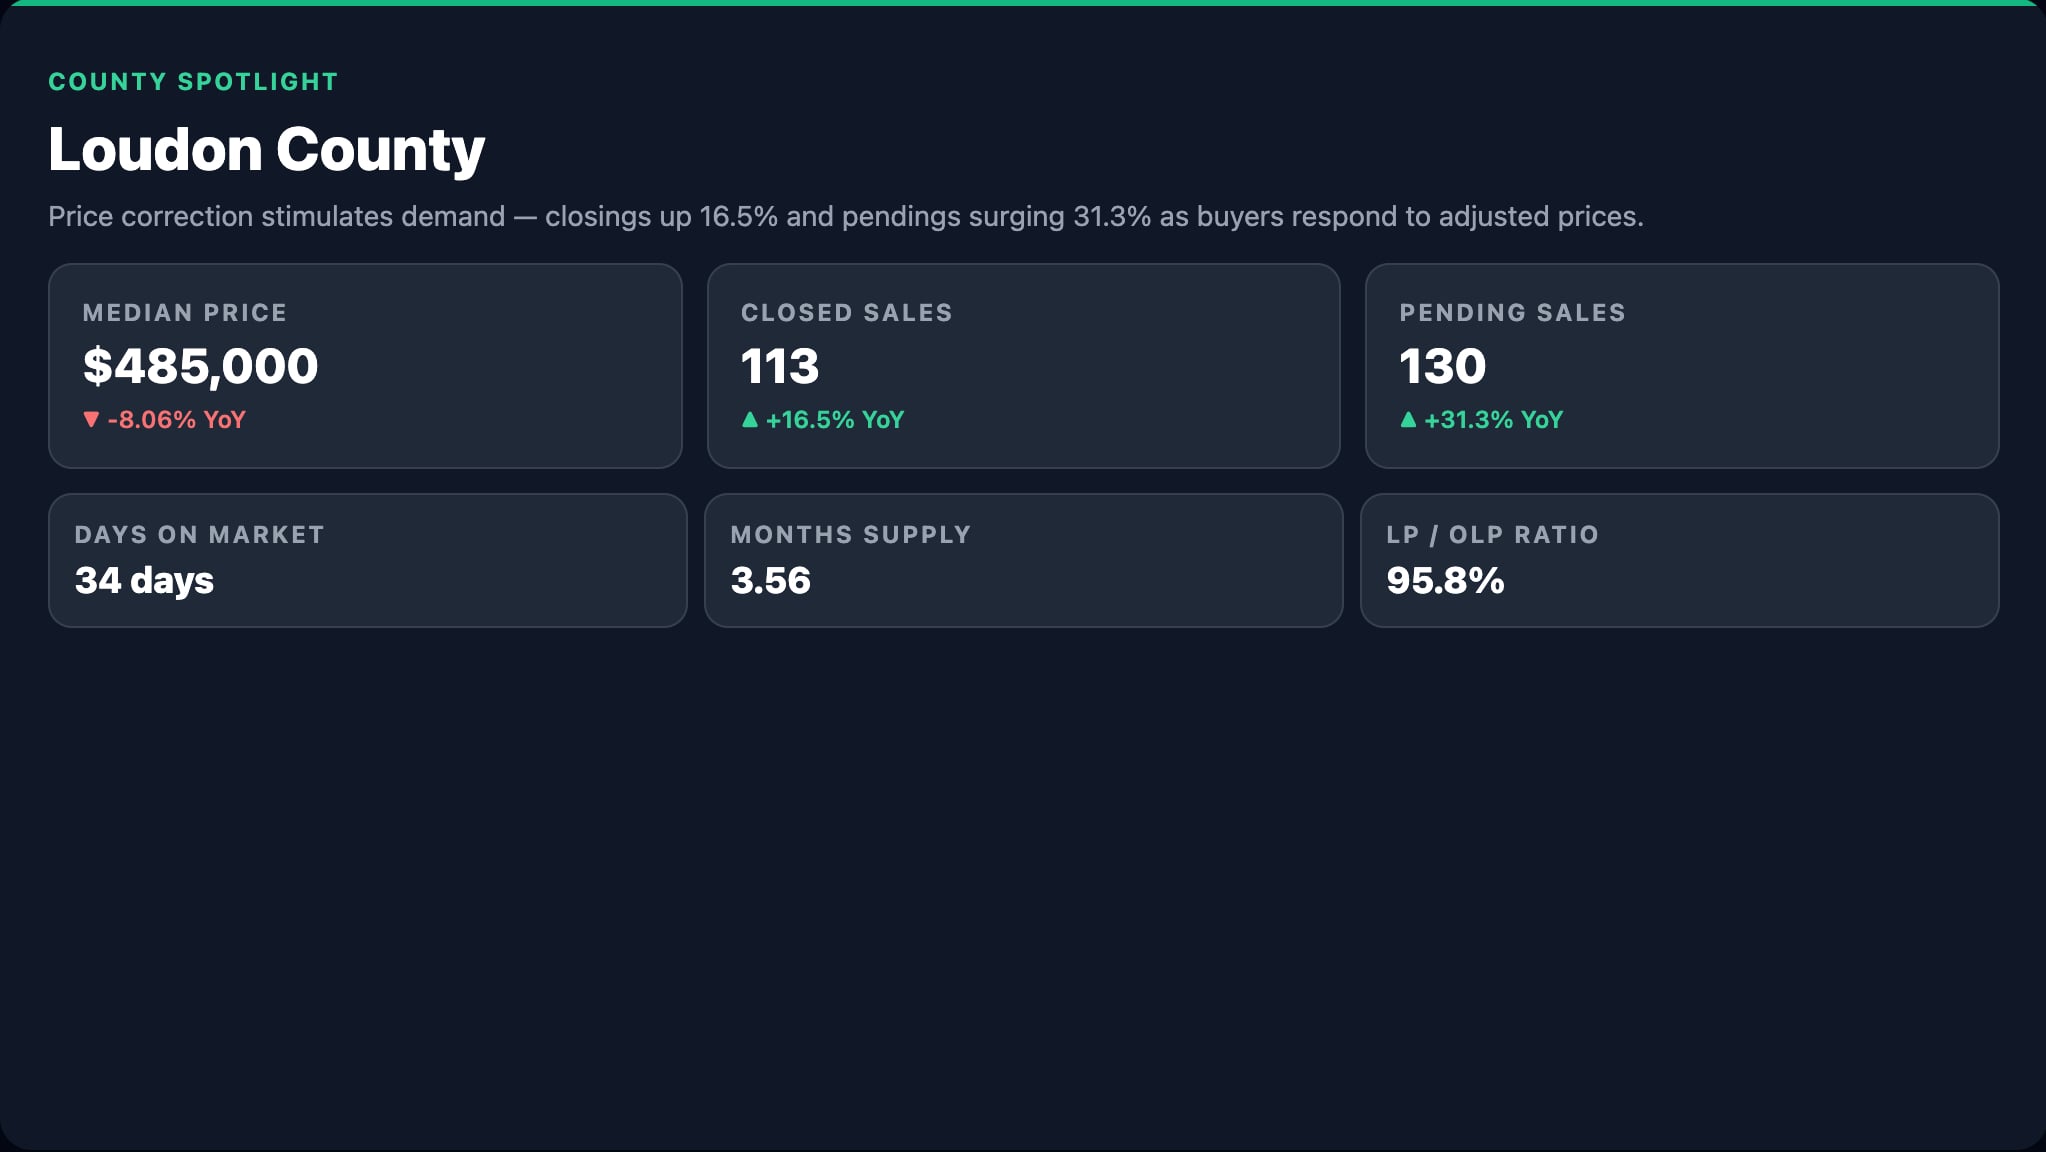
Loudon County Housing Market: The Transformation Story of 2026
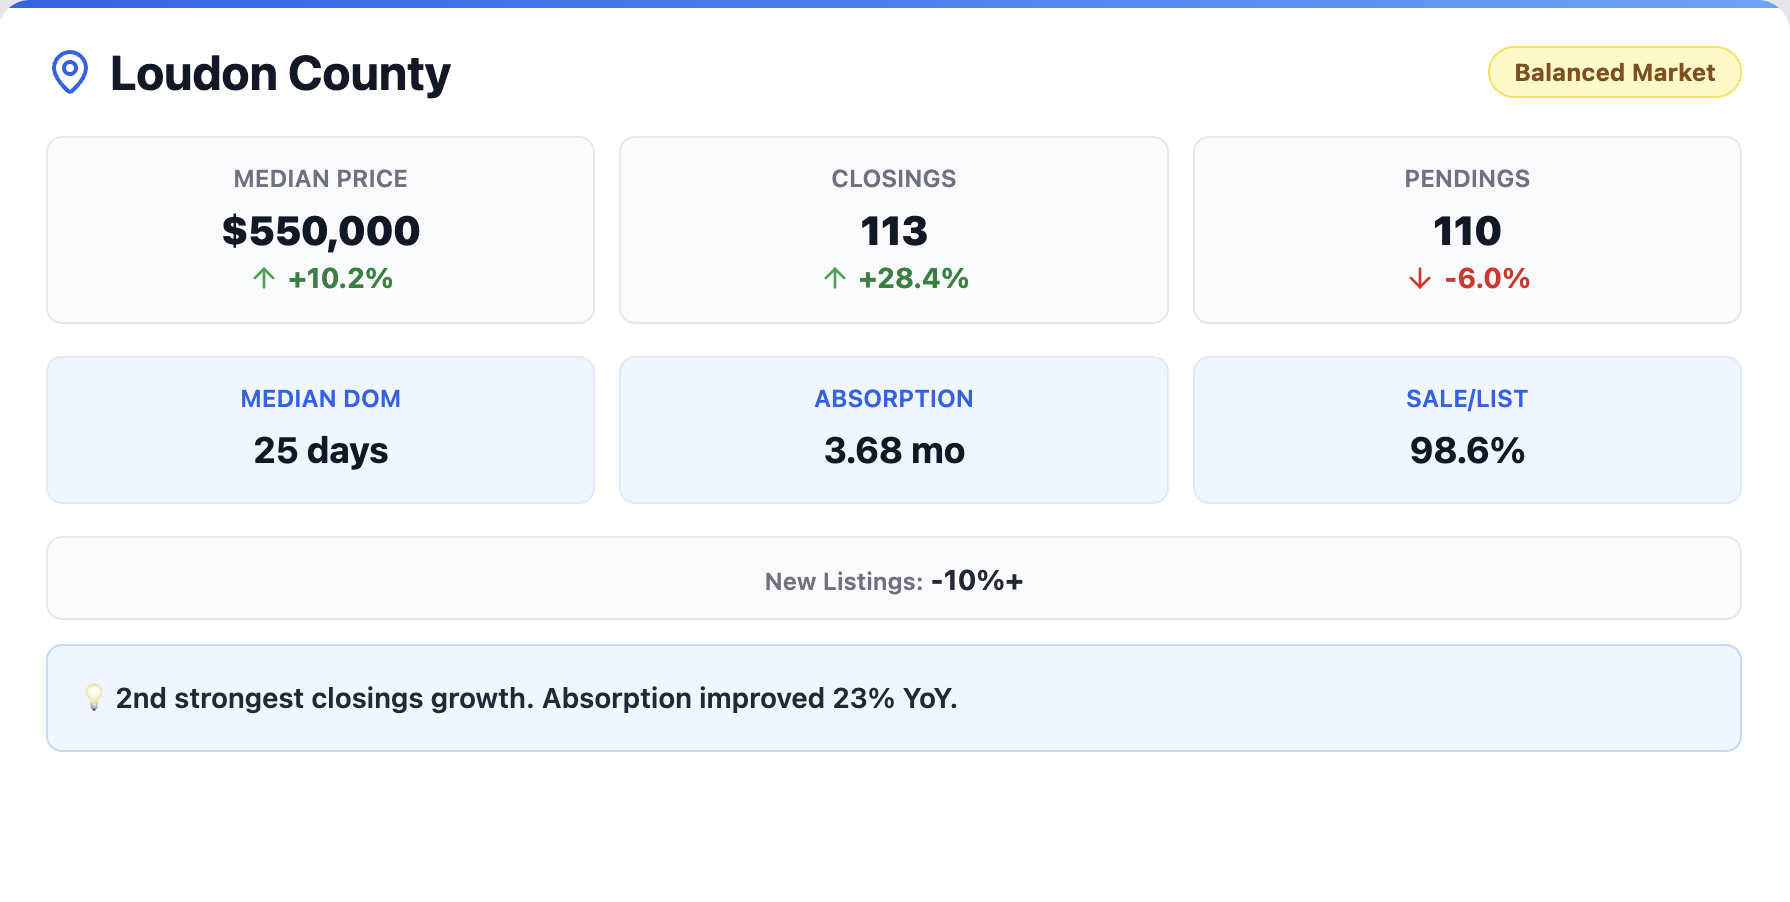
Loudon County is undergoing the most dramatic market shift in the region. Just 12 months ago, the absorption rate sat at 5.07 months — a soft, buyer-leaning market. Today it’s 3.63 months. Active listings are down 15.7% year over year. This market has gone from soft to competitive in a single year, and the momentum shows no signs of reversing.
Sellers in Loudon County have their strongest positioning in over a year. Expect median home prices to hold in the $580K–$625K range through year end, with potential for further appreciation if inventory continues its downward trajectory. If you’ve been on the fence about listing your Loudon County home, the data suggests your negotiating position is only getting stronger.
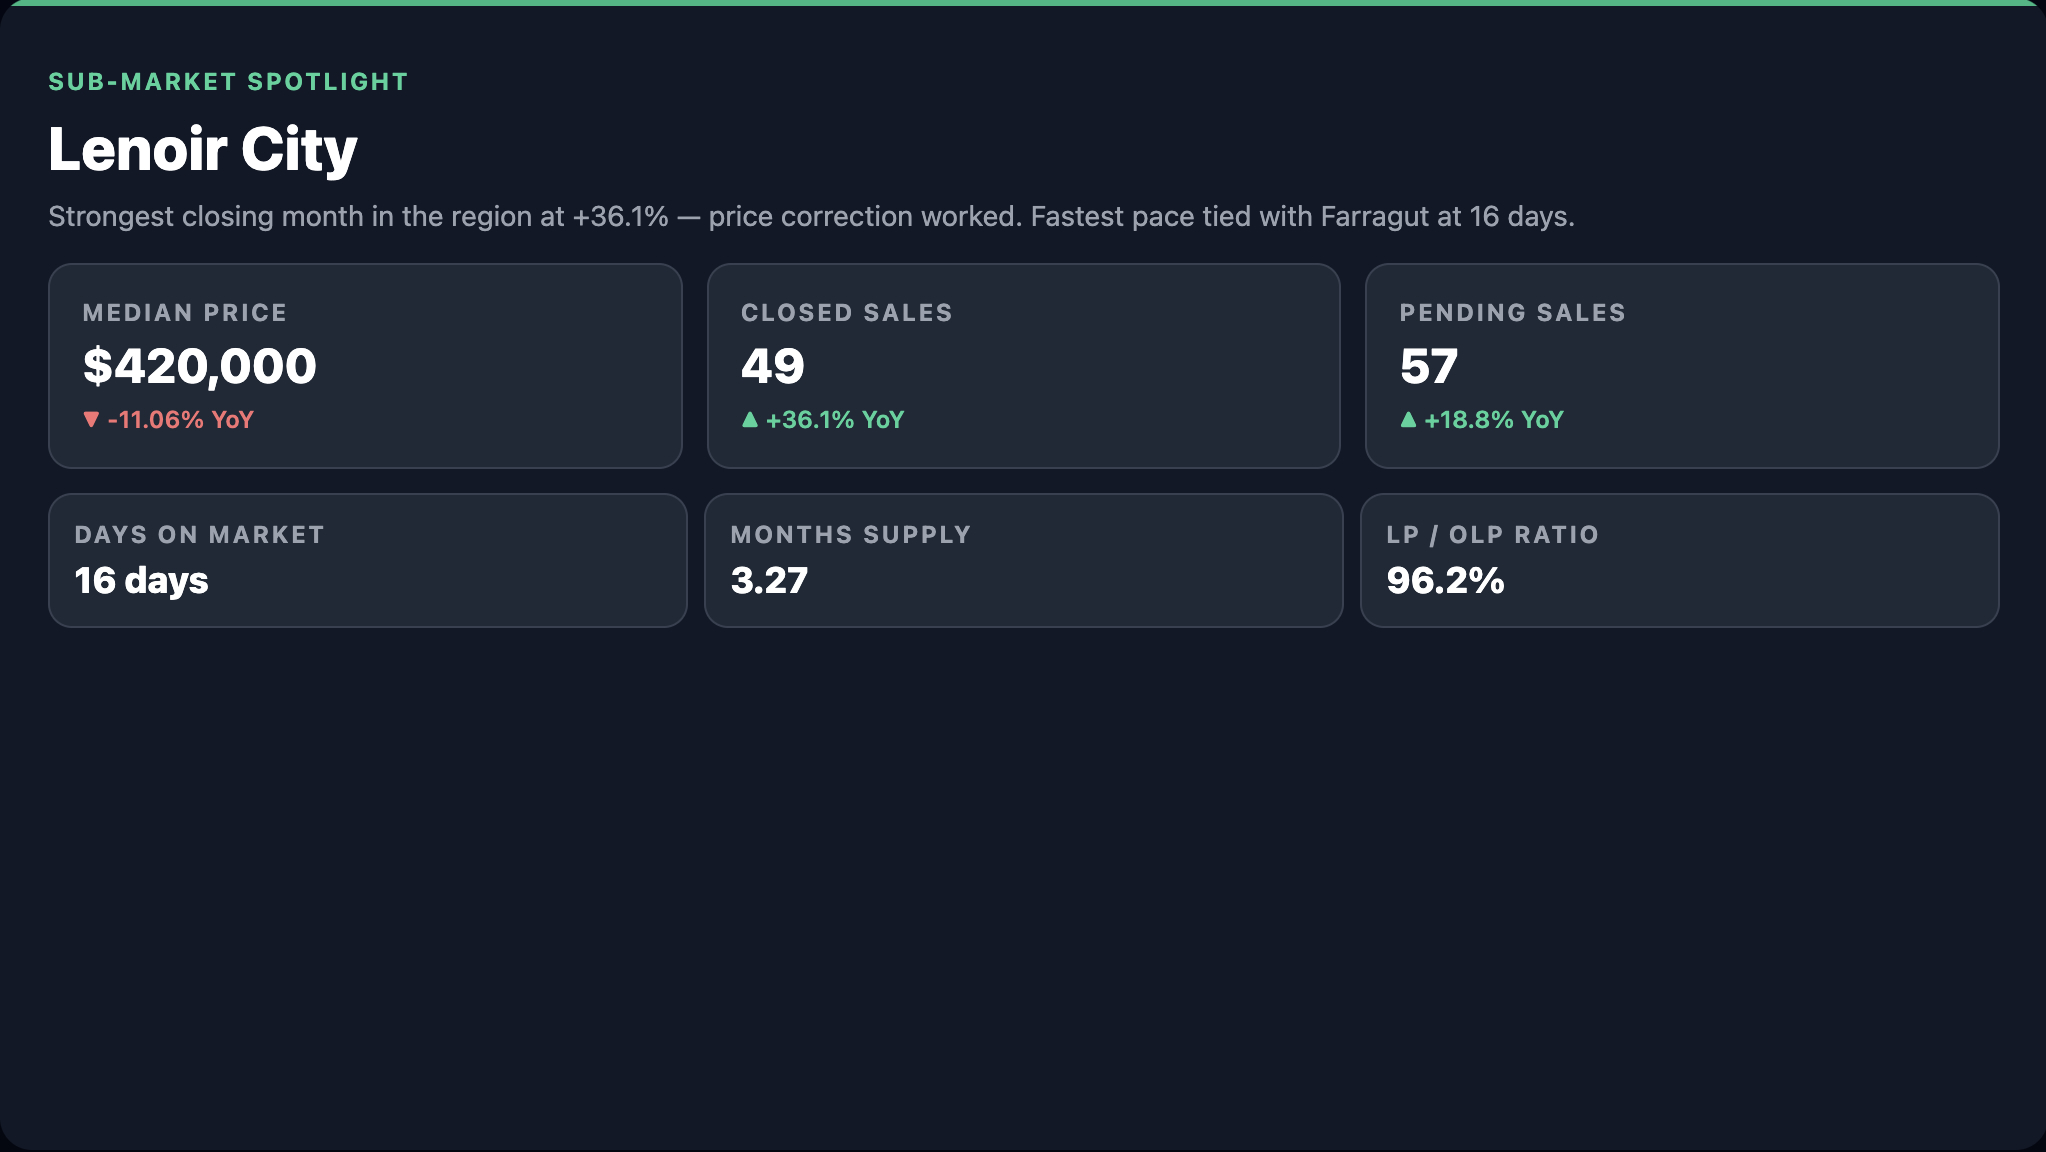
Lenoir City Real Estate: A Market at a Crossroads
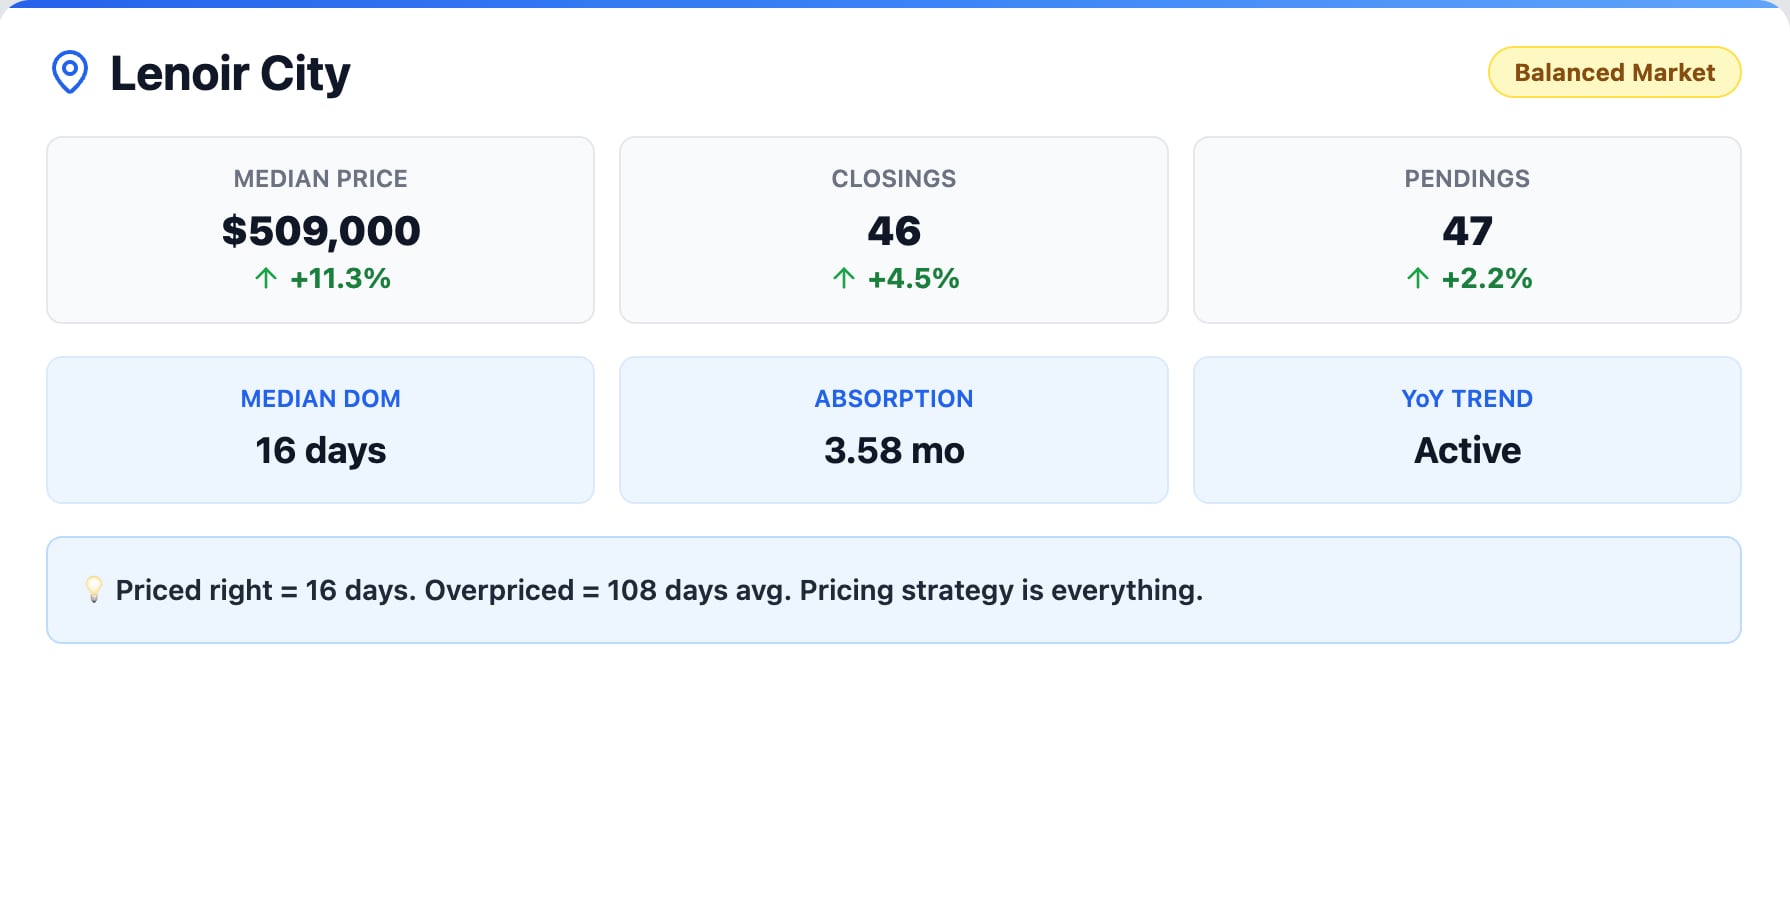
Lenoir City is the market I’m watching most closely right now. The median home price surged 18.88% in June, the largest percentage gain in the region. But pending sales dropped 15.4%. That’s a tension that needs to resolve one way or the other, and the answer will shape Lenoir City’s trajectory for the rest of the year.
If June’s price jump was driven by a cluster of higher-priced closings in a small sample — what analysts call a sales-mix effect — then the median will normalize back toward the $490K–$510K range in coming months. But if it reflects genuine appreciation driven by Loudon County spillover demand, Lenoir City may be entering a new pricing tier permanently. The pending sales decline suggests some buyer resistance at the new price level. The next 2 months of data will be critical, and I’ll be reporting on exactly what they reveal.
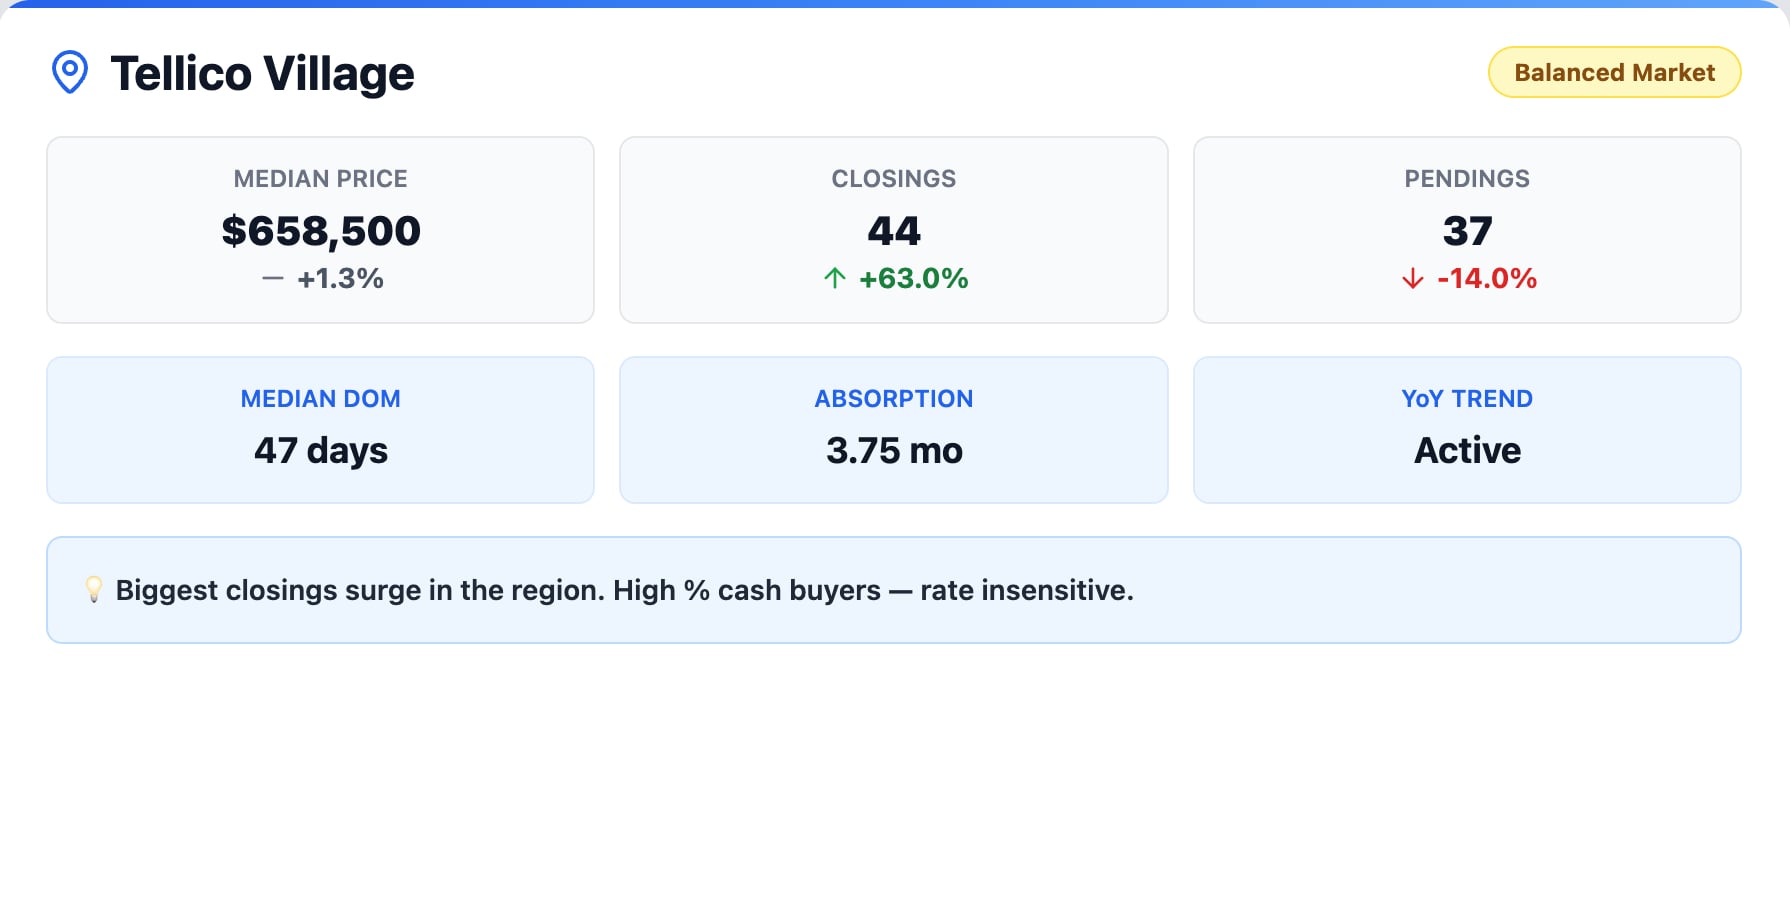
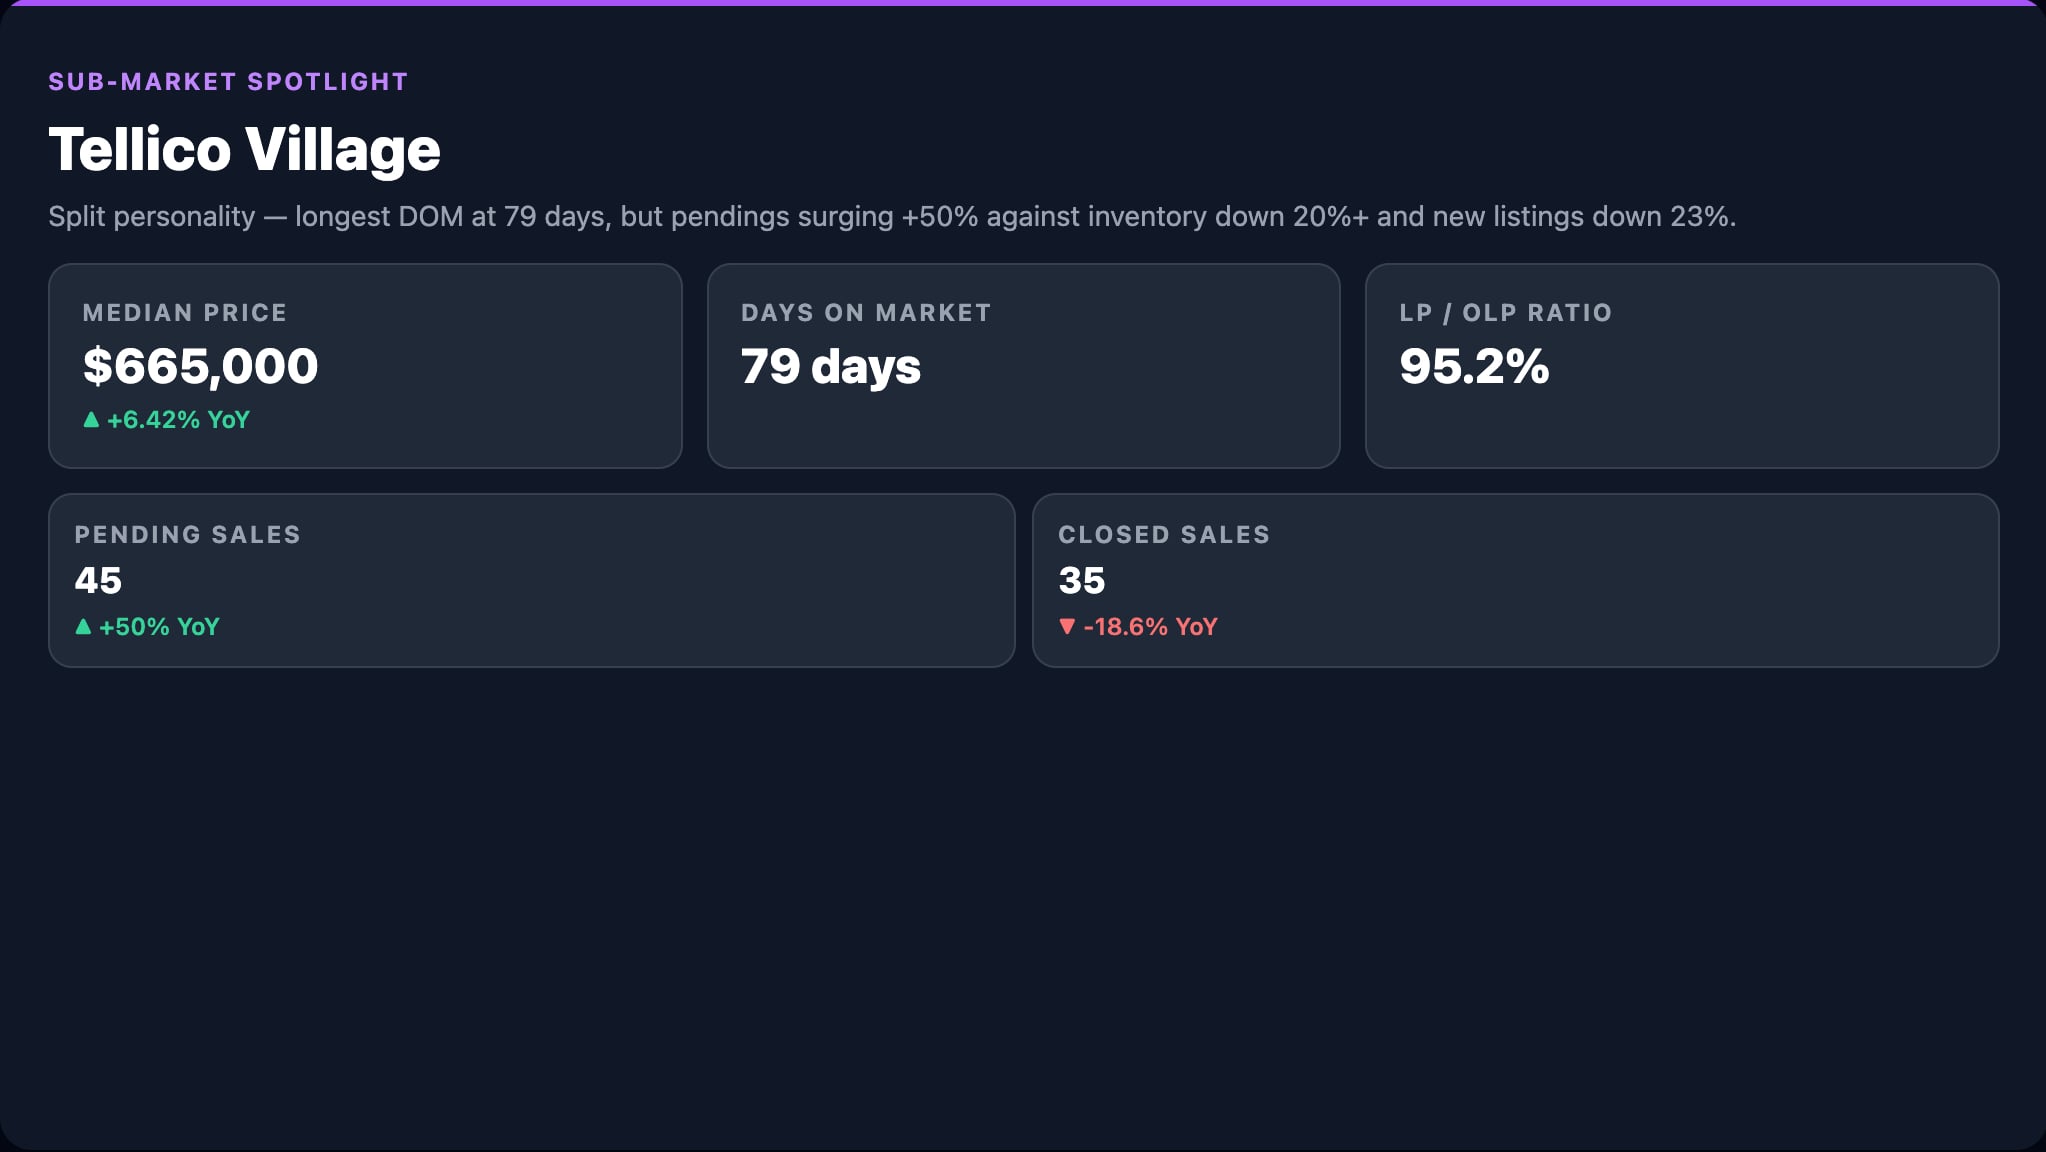
Tellico Village Market Update
Tellico Village has decisively shifted into a seller’s market. The absorption rate sits at 3.6 months and is trending downward. The median home price is in the $650K–$700K range, and the sale-to-list ratio is 99.8%, meaning homes are selling at virtually full asking price.
The retirement and second-home buyer demographic that drives Tellico Village is less sensitive to mortgage rates than the broader market. Many of these buyers are paying cash or making large down payments, which insulates the community from rate volatility and gives sellers confidence to hold firm on pricing through the fall selling season. If you own a home in Tellico Village and have been thinking about listing, the market conditions are firmly in your favor.
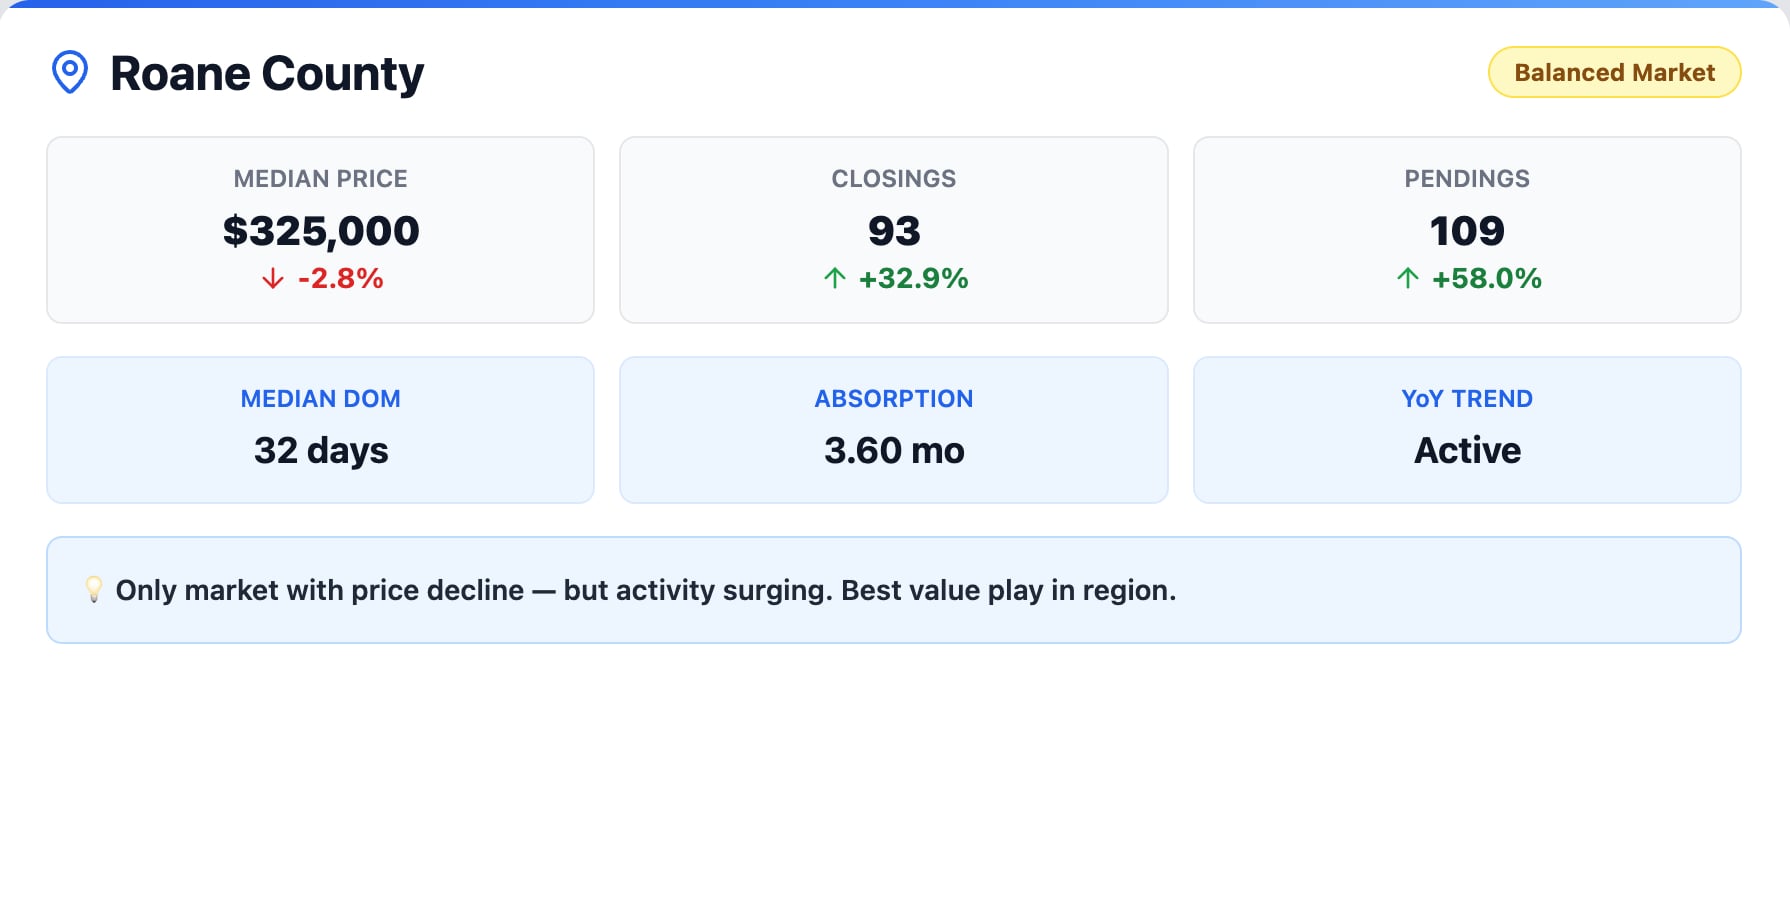
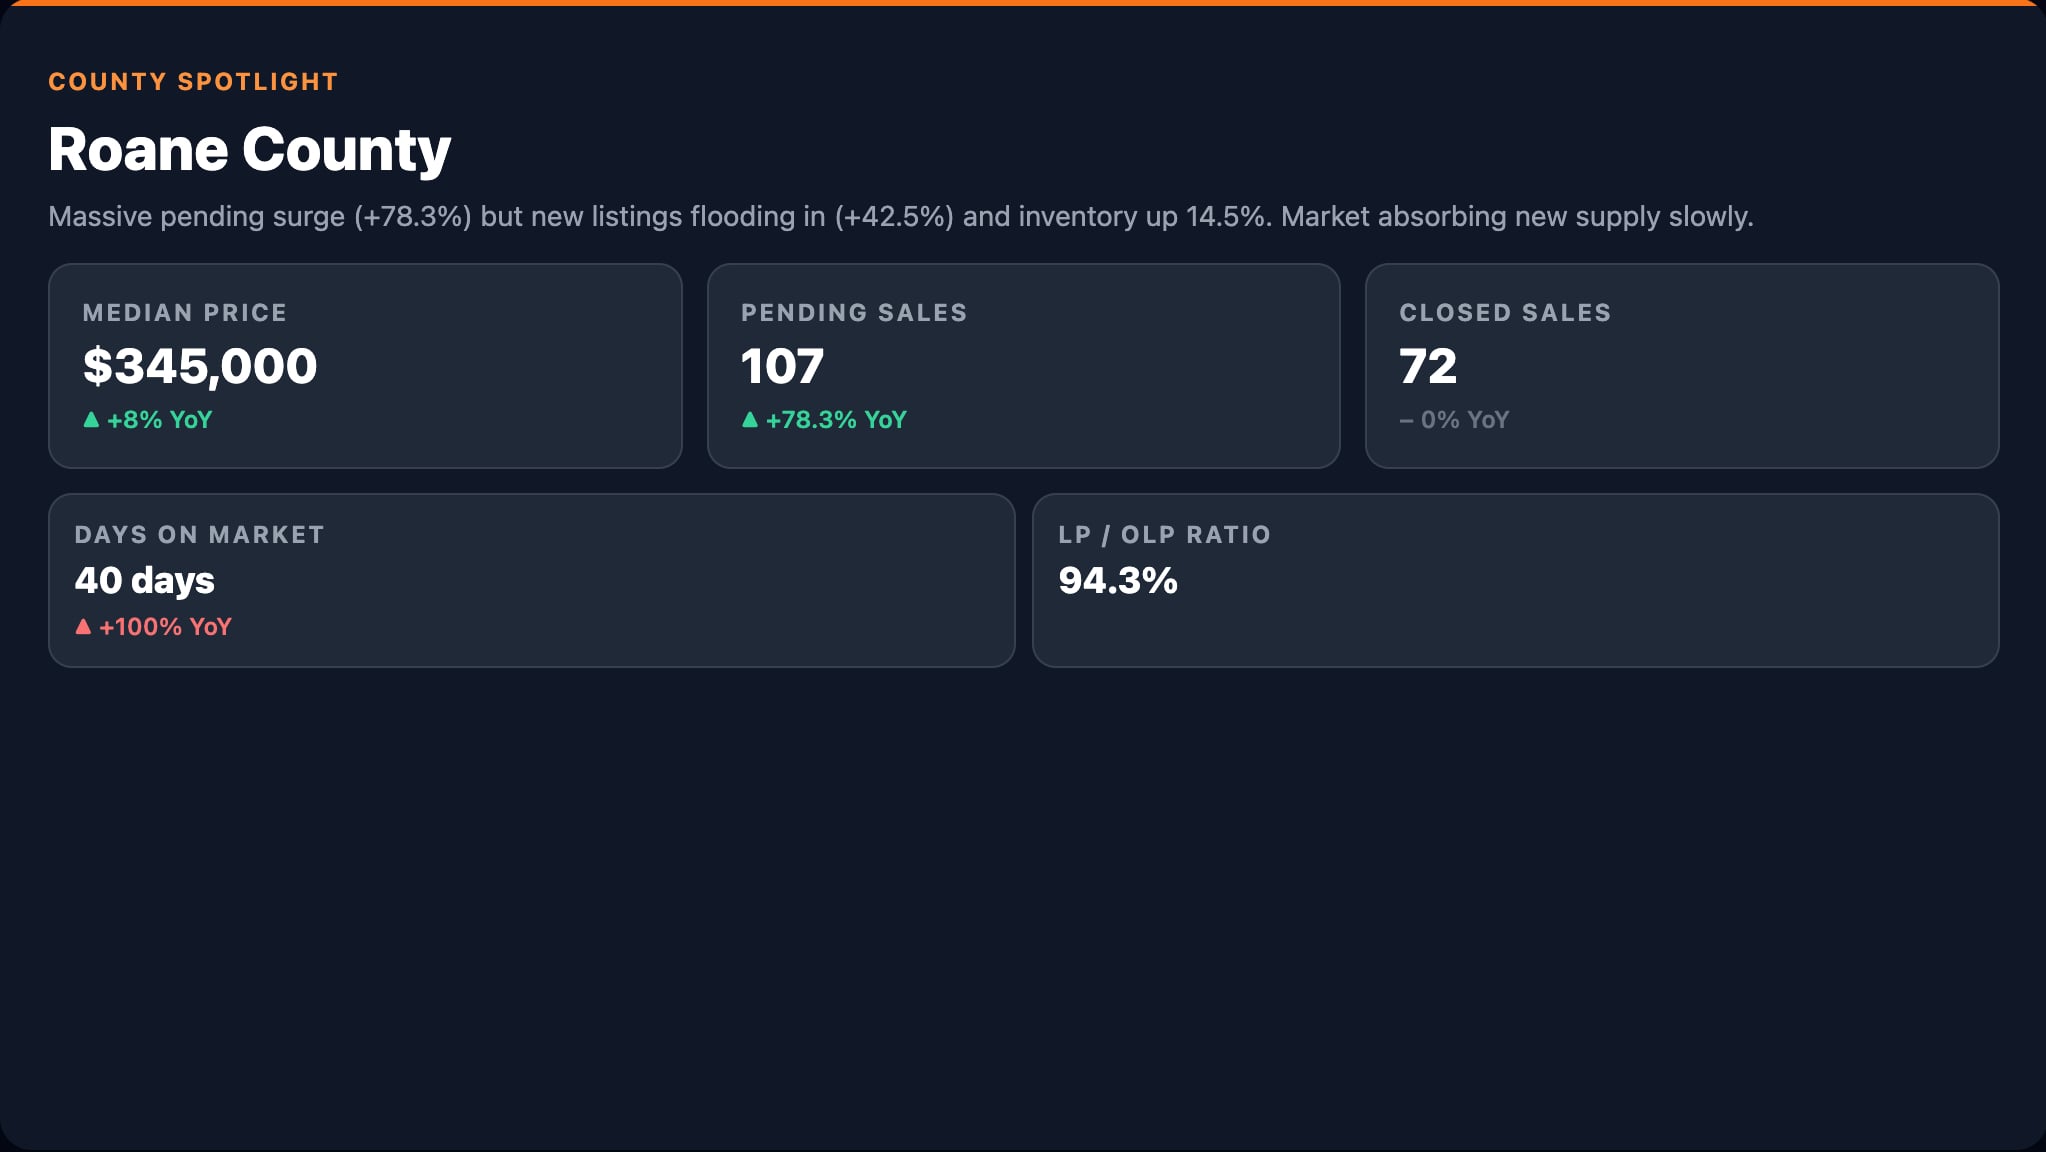
Roane County Real Estate: A Dramatic Turnaround
Roane County’s turnaround is one of the most compelling stories in this report. Previously the region’s weakest price performer, Roane County posted one of the strongest gains in June — up over 14% year over year to a median of $385,500. Closings rose 19.3%, pending sales increased 11.4%, and the absorption rate sits at a healthy 3.24 months.
Roane County has established itself as a viable and increasingly popular alternative for buyers priced out of Knox, Blount, and Loudon counties. Expect the median to settle in the $350K–$385K range for the year, with the upper end more probable if current demand continues. This is a market that has earned serious attention from buyers looking for strong fundamentals at a lower price point.
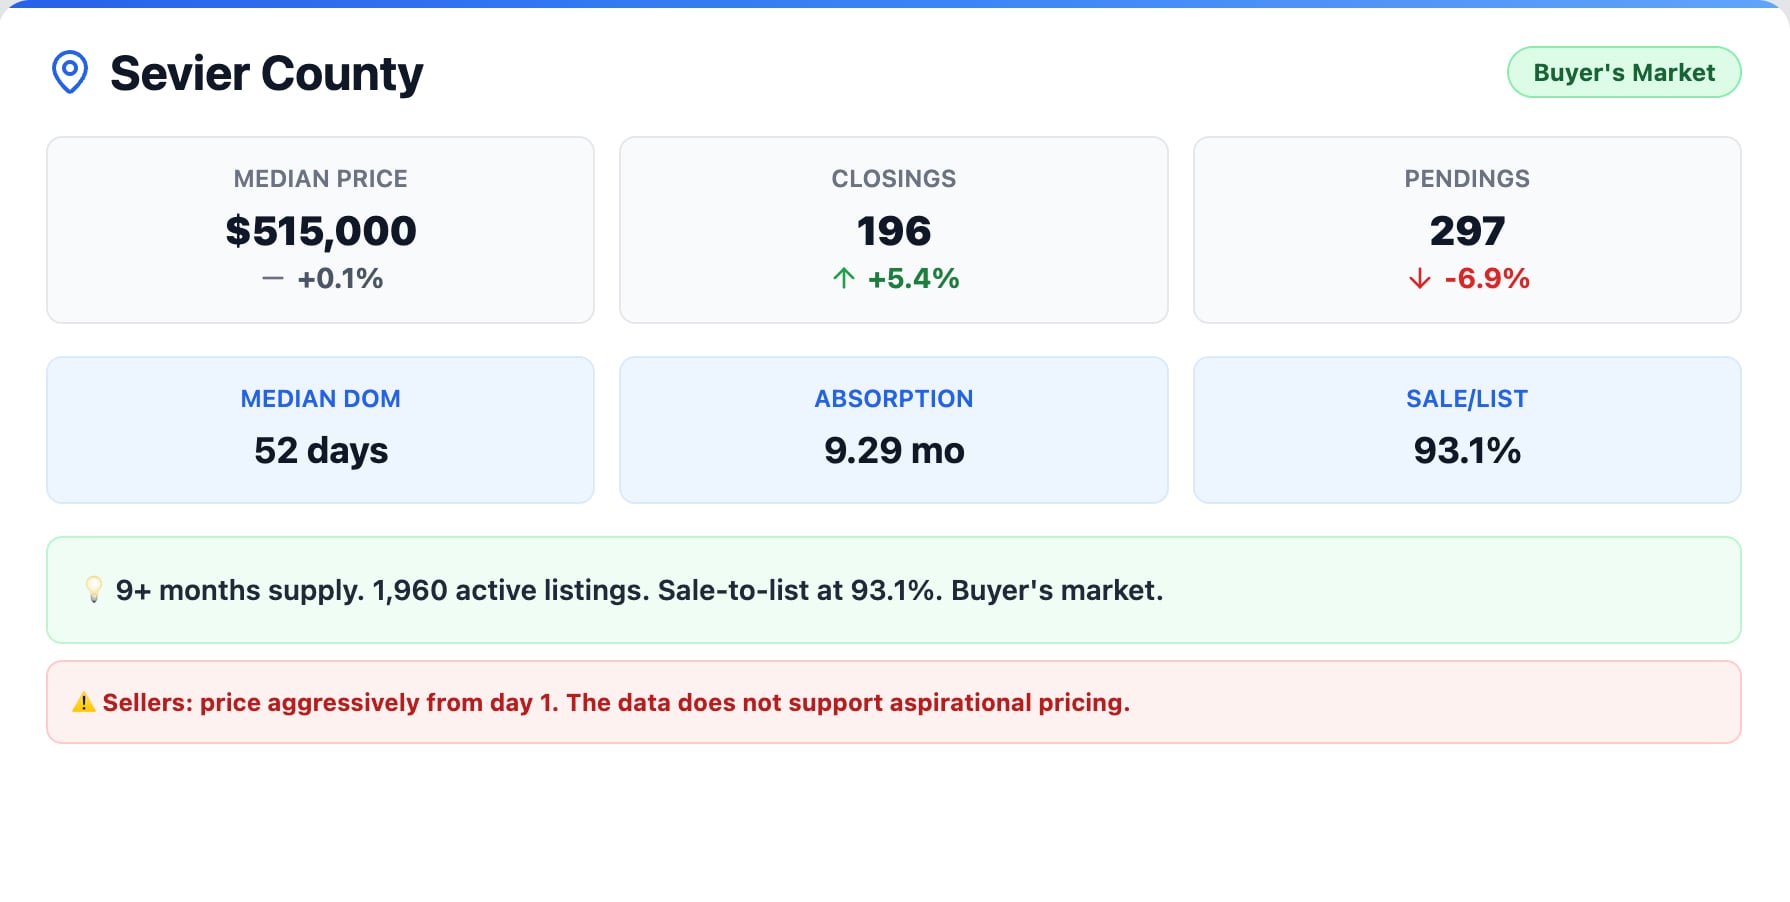
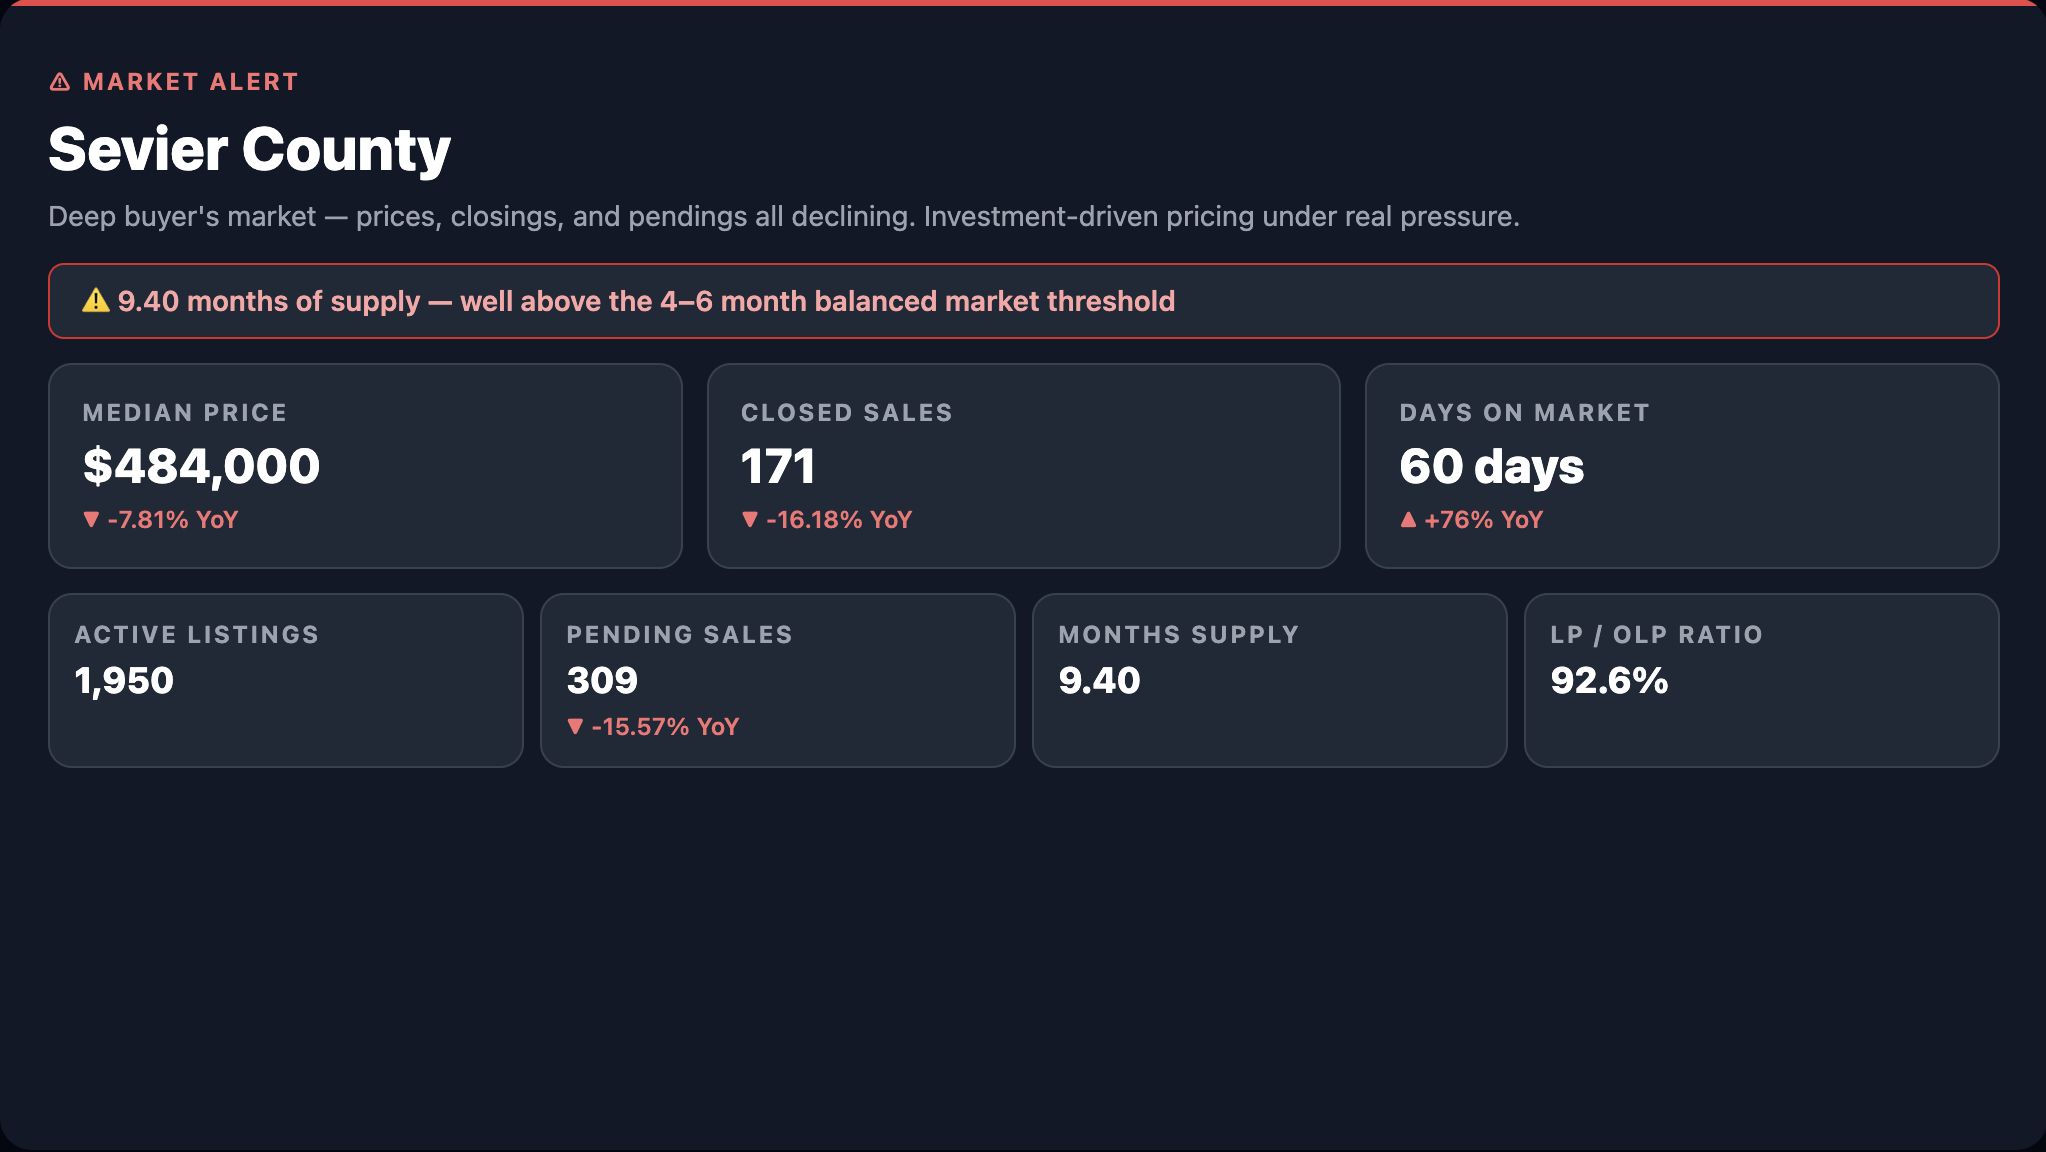
Sevier County Housing Market: Still a Buyer’s Market
Sevier County remains the region’s outlier. The supply overhang sits at 9.29 months, which is far too large to work through in a single selling season. The structural issue is clear — the inventory is concentrated in investment properties and former short-term rentals that don’t attract the same organic, primary-residence demand driving the other 8 markets in this report.
There are positive signs. Closings rose 21.3% year over year in June, and the median home price is gradually recovering toward the $490K–$510K range. But sellers in Sevier County should continue to price aggressively and expect longer marketing times. The oil price spike adds particular risk here, because higher gas prices directly impact tourism-dependent economies and could shrink the pool of vacation-property buyers considering the Smokies.
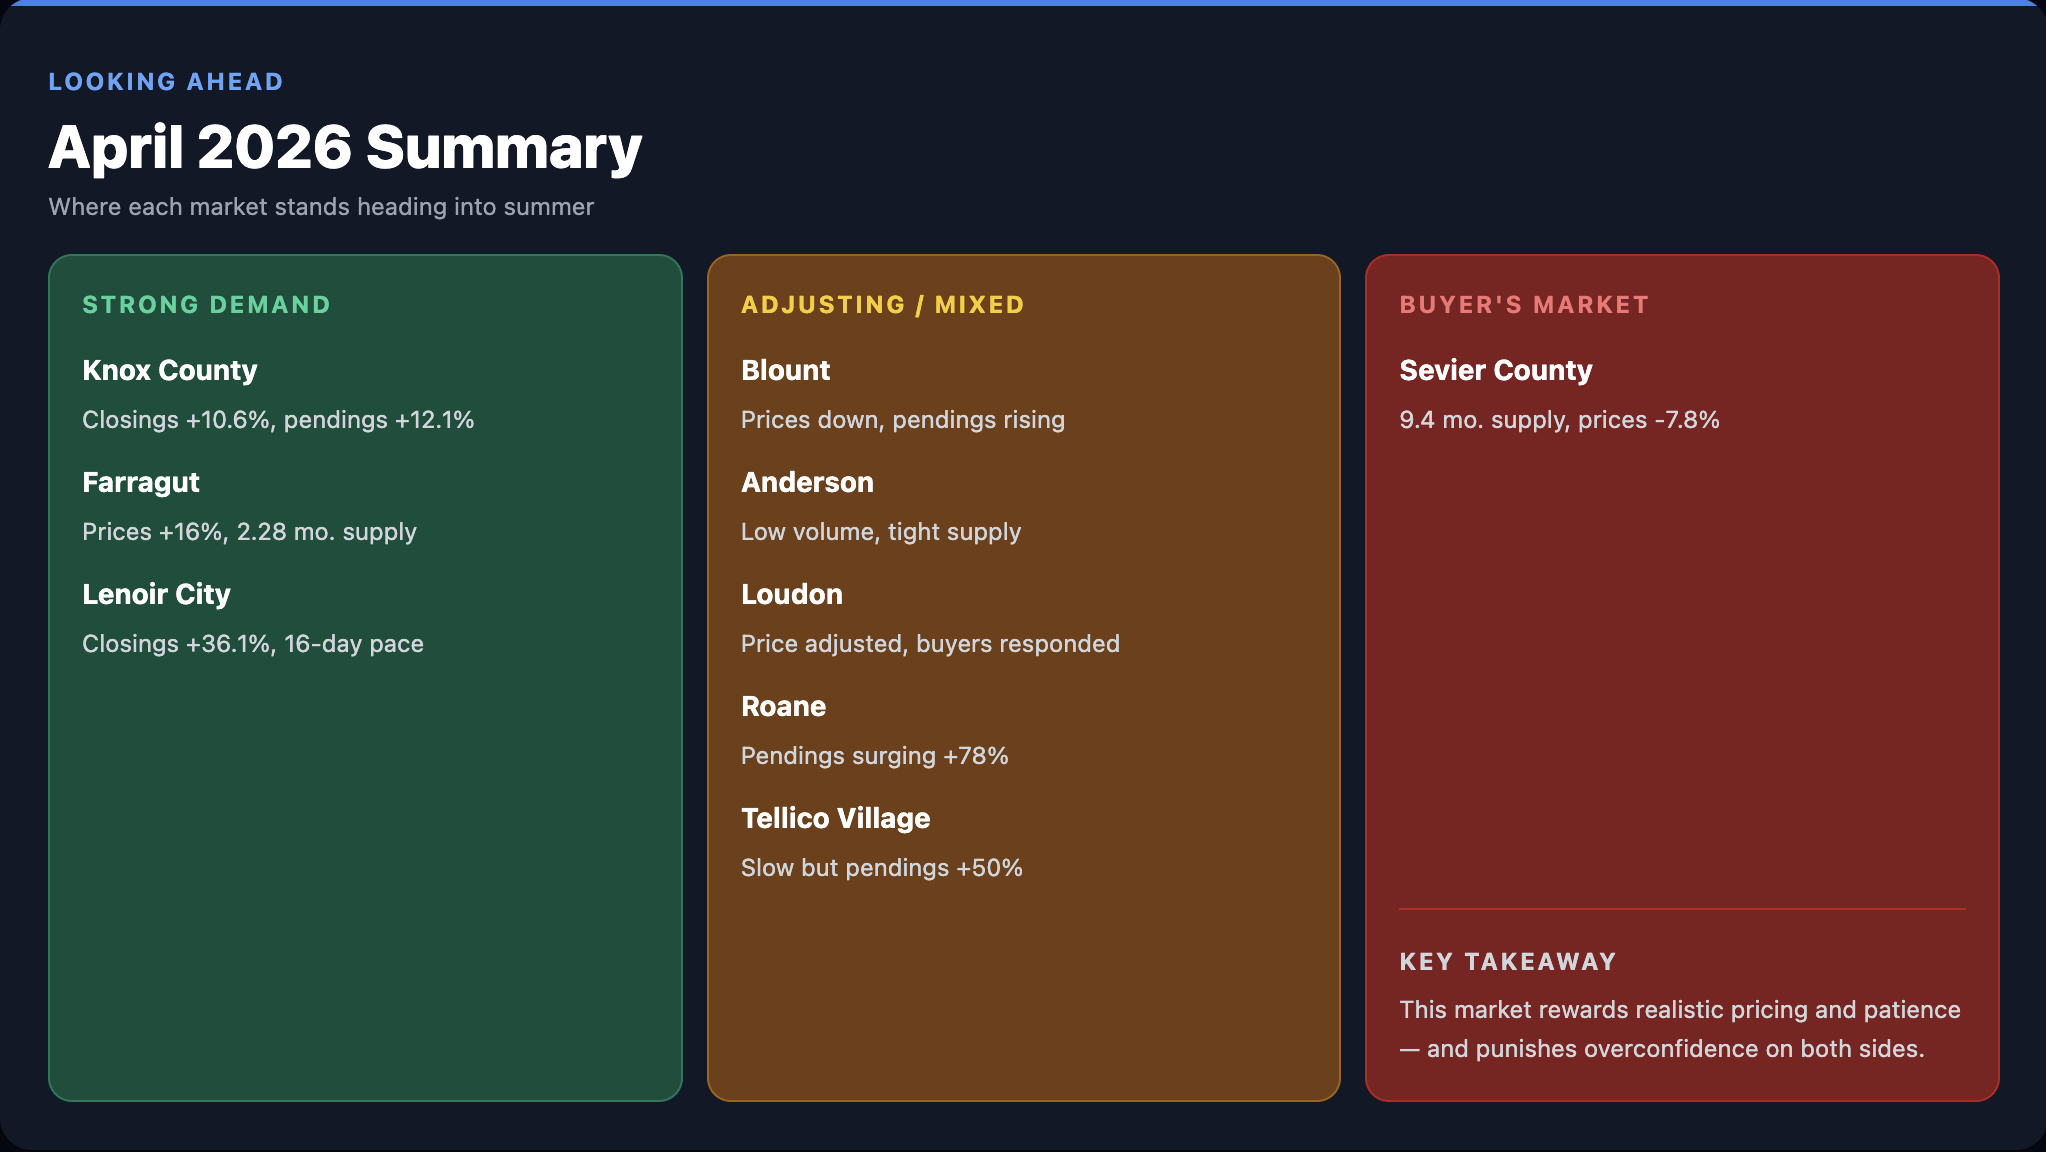
East Tennessee Housing Market Forecast: Second Half of 2026
Here’s how the second half of 2026 is shaping up across the region.
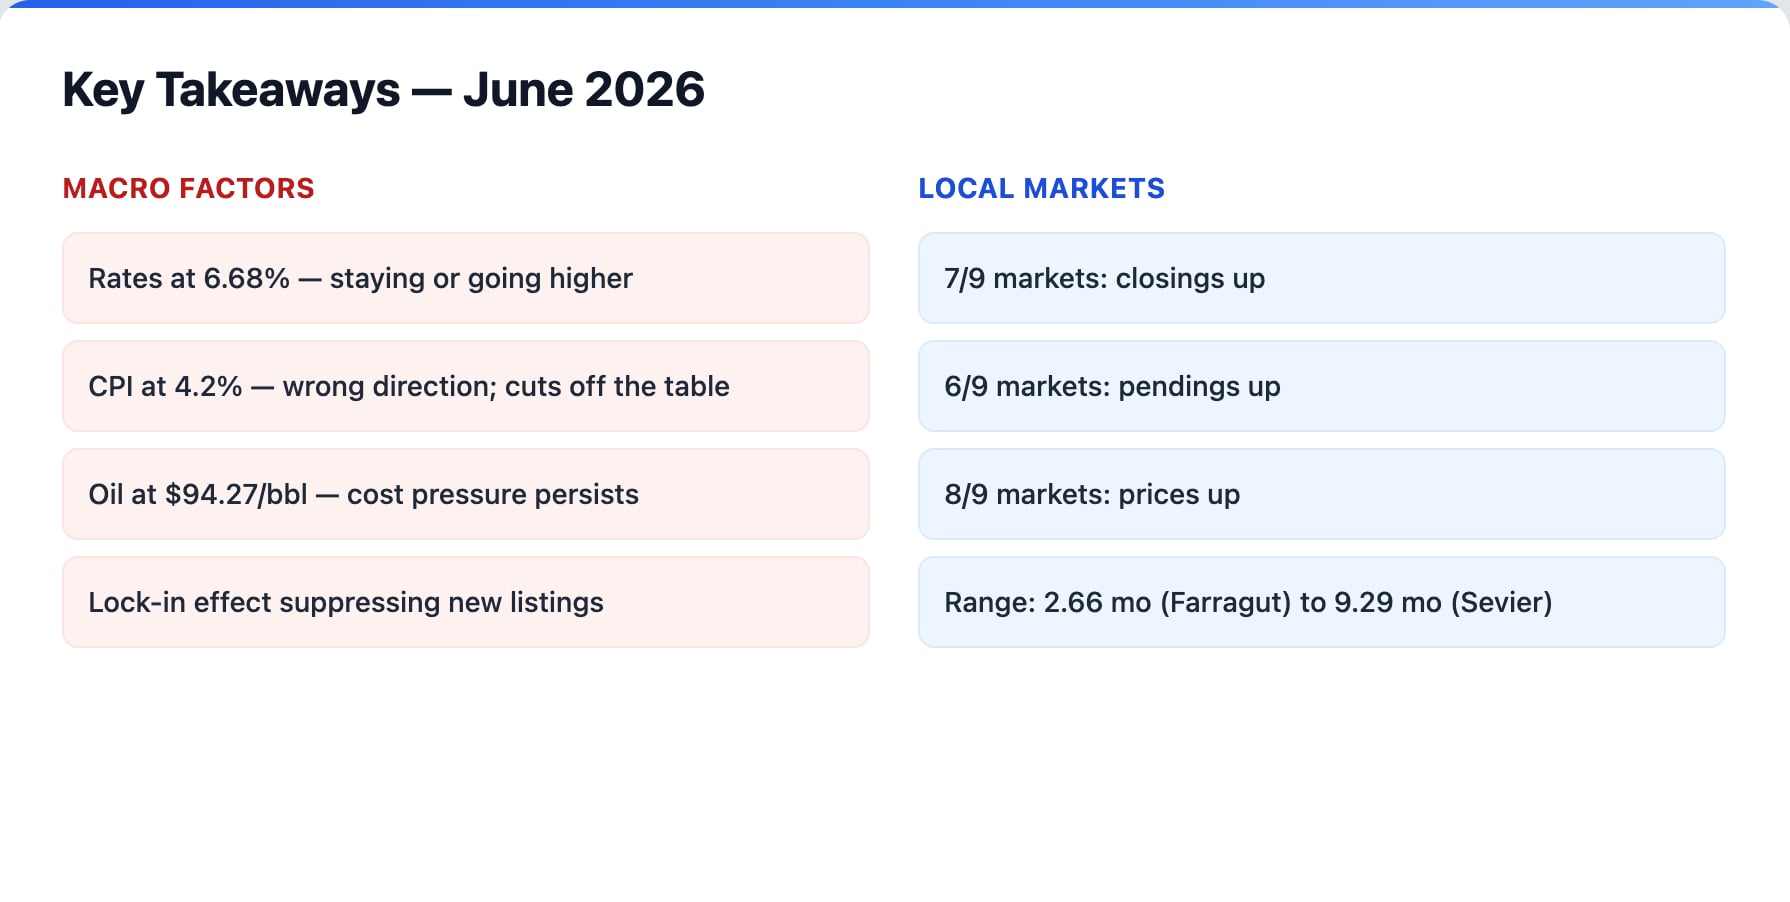
Mortgage rates will trade between 6.4% and 7.1% through year end, with no rate cuts expected. Regional closings volume will moderate from June’s strong numbers but remain positive through Q3. Seasonal cooling will temper Q4 as it always does, but the floor for transaction volume is higher this year than it was last year. Prices across East Tennessee will appreciate at a moderate 3–7% year over year, with significant variation by market. Knox County stays stable, Farragut and Loudon County have the most upward pricing power, and Sevier County continues its gradual recovery.
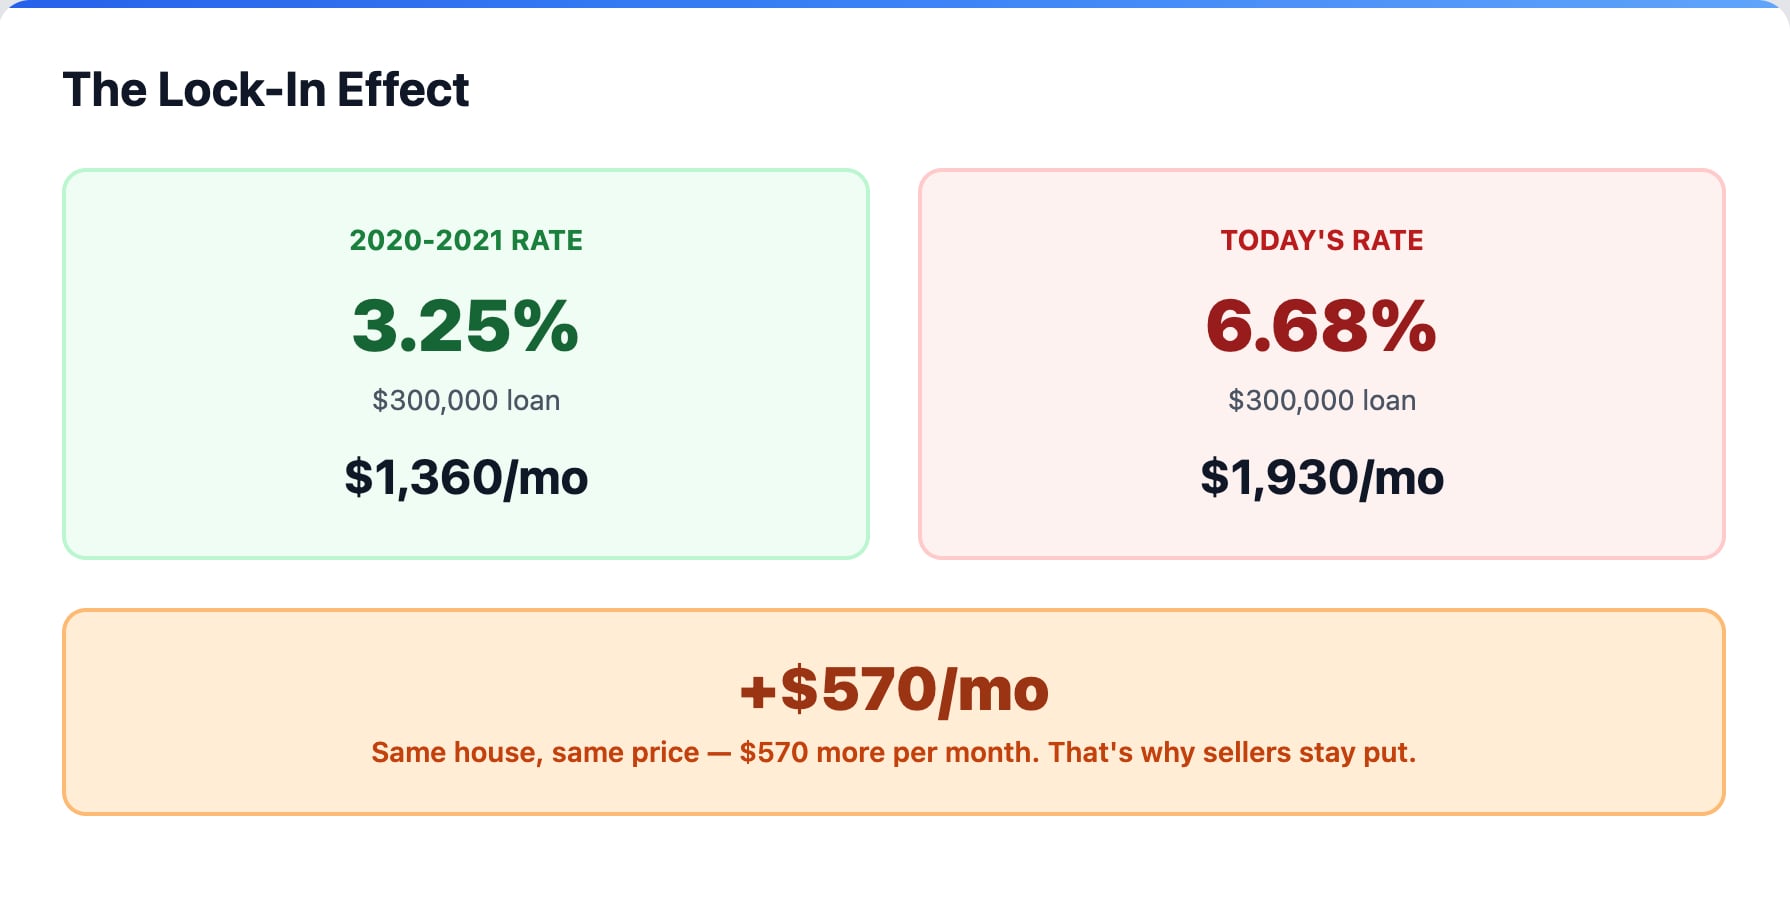
The single most important variable for the second half is inventory. The lock-in effect — where homeowners with 3–4% mortgage rates face $800–$1,200 more per month if they sell and buy at today’s rates — will continue to suppress new listings as long as rates stay above 6%. Markets already tightening, including Farragut, Loudon County, Tellico Village, and Blount County, are likely to get even tighter through the summer.
How to Position Yourself in Today’s East Tennessee Market
The markets with the most pricing power heading into the second half are Farragut, Loudon County, and Tellico Village. Declining inventory and strong demand give sellers in these markets clear leverage.
The best value opportunities for buyers are in Anderson County and Roane County, where median prices sit well below the regional average while market fundamentals continue to strengthen.
Lenoir City and Blount County are the markets to watch most closely. Lenoir City needs to prove whether its price surge is sustainable, and Blount County’s absorption rate is approaching a tipping point into strong seller’s territory.
Sevier County remains the lone buyer’s market, with nearly 10 months of supply and structural inventory challenges that won’t resolve quickly.
The Bottom Line for East Tennessee Real Estate
Rates near 7% are the reality we’re working within, and every market in this report proved in June that transactions happen and value exists even at these levels. Inventory constrained by the lock-in effect is the dominant force shaping prices and competition across the region. And oil prices, driven by escalating tensions near the Strait of Hormuz, are the wildcard that could reshape the economic landscape in ways that ripple directly into our local communities.
Whether you’re buying or selling, the most important thing you can do right now is make decisions based on current conditions rather than hypothetical future ones. The data is clear, the trends are identifiable, and opportunities exist across every price point and market in East Tennessee.
If you’d like to talk through what the latest data means for your specific situation, I’m here to help. Reach out anytime for a no-obligation conversation about your next move in the East Tennessee housing market.
This analysis is based on MLS data downloaded July 13, 2026, with macroeconomic data current as of July 14 and 15, 2026.