Between Two Storms: What February 2026 Reveals — and Conceals — About East Tennessee Real Estate
If last month’s analysis was a story about contradictions, this month’s is a story about distortions. The February 2026 data for the Knoxville and East Tennessee housing market landed carrying a heavy asterisk — the late-January winter storm that delayed closings, inspections, and appraisals pushed a measurable volume of activity into February, inflating some numbers and obscuring others. And just as that first storm’s effects begin to clear, a second one — this time geopolitical — appeared on the last day of the month. The United States’ entry into armed conflict in Iran, which began on February 28th, introduces a new variable into the spring housing outlook that did not exist 30 days ago. And that variable is already showing up in the numbers that matter most to homebuyers: mortgage rates have climbed to 6.29% as of mid-March, and crude oil has surged past $100 a barrel for the first time in over a year.
But storms pass. Data accumulates. And when you strip away the noise and look at what February is actually telling us about this market, the signals are remarkably clear — and remarkably different depending on which county you’re standing in.
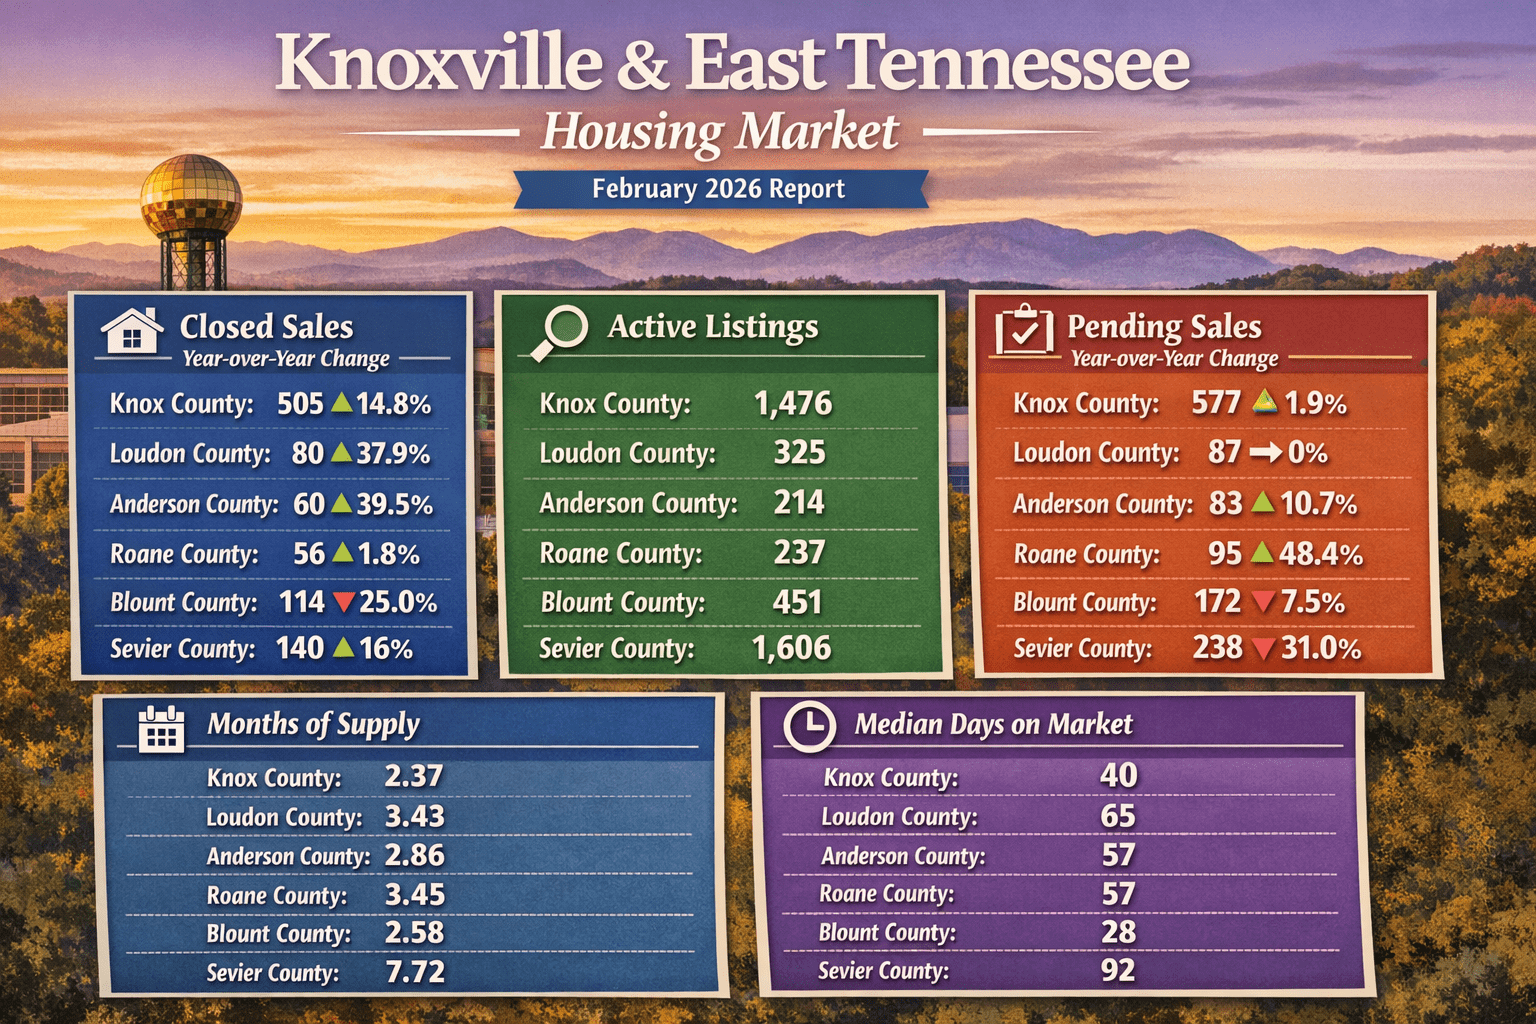
Across the six core counties — Anderson, Knox, Blount, Loudon, Roane, and Sevier — 955 homes closed in February 2026, a 9.9% increase over February 2025 and a notable acceleration from January’s 5.3% growth. But before you read that as unambiguous good news, understand that a meaningful portion of those closings were deals that should have finalized in January but were pushed into February by the storm. The true underlying pace of the market is somewhere between January’s weather-suppressed numbers and February’s weather-inflated ones. Neither month, in isolation, tells the whole story.
The Storm Effect: Why Some Counties Look Artificially Strong
The fingerprints of the late-January storm are all over February’s county-level data, but they show up unevenly.
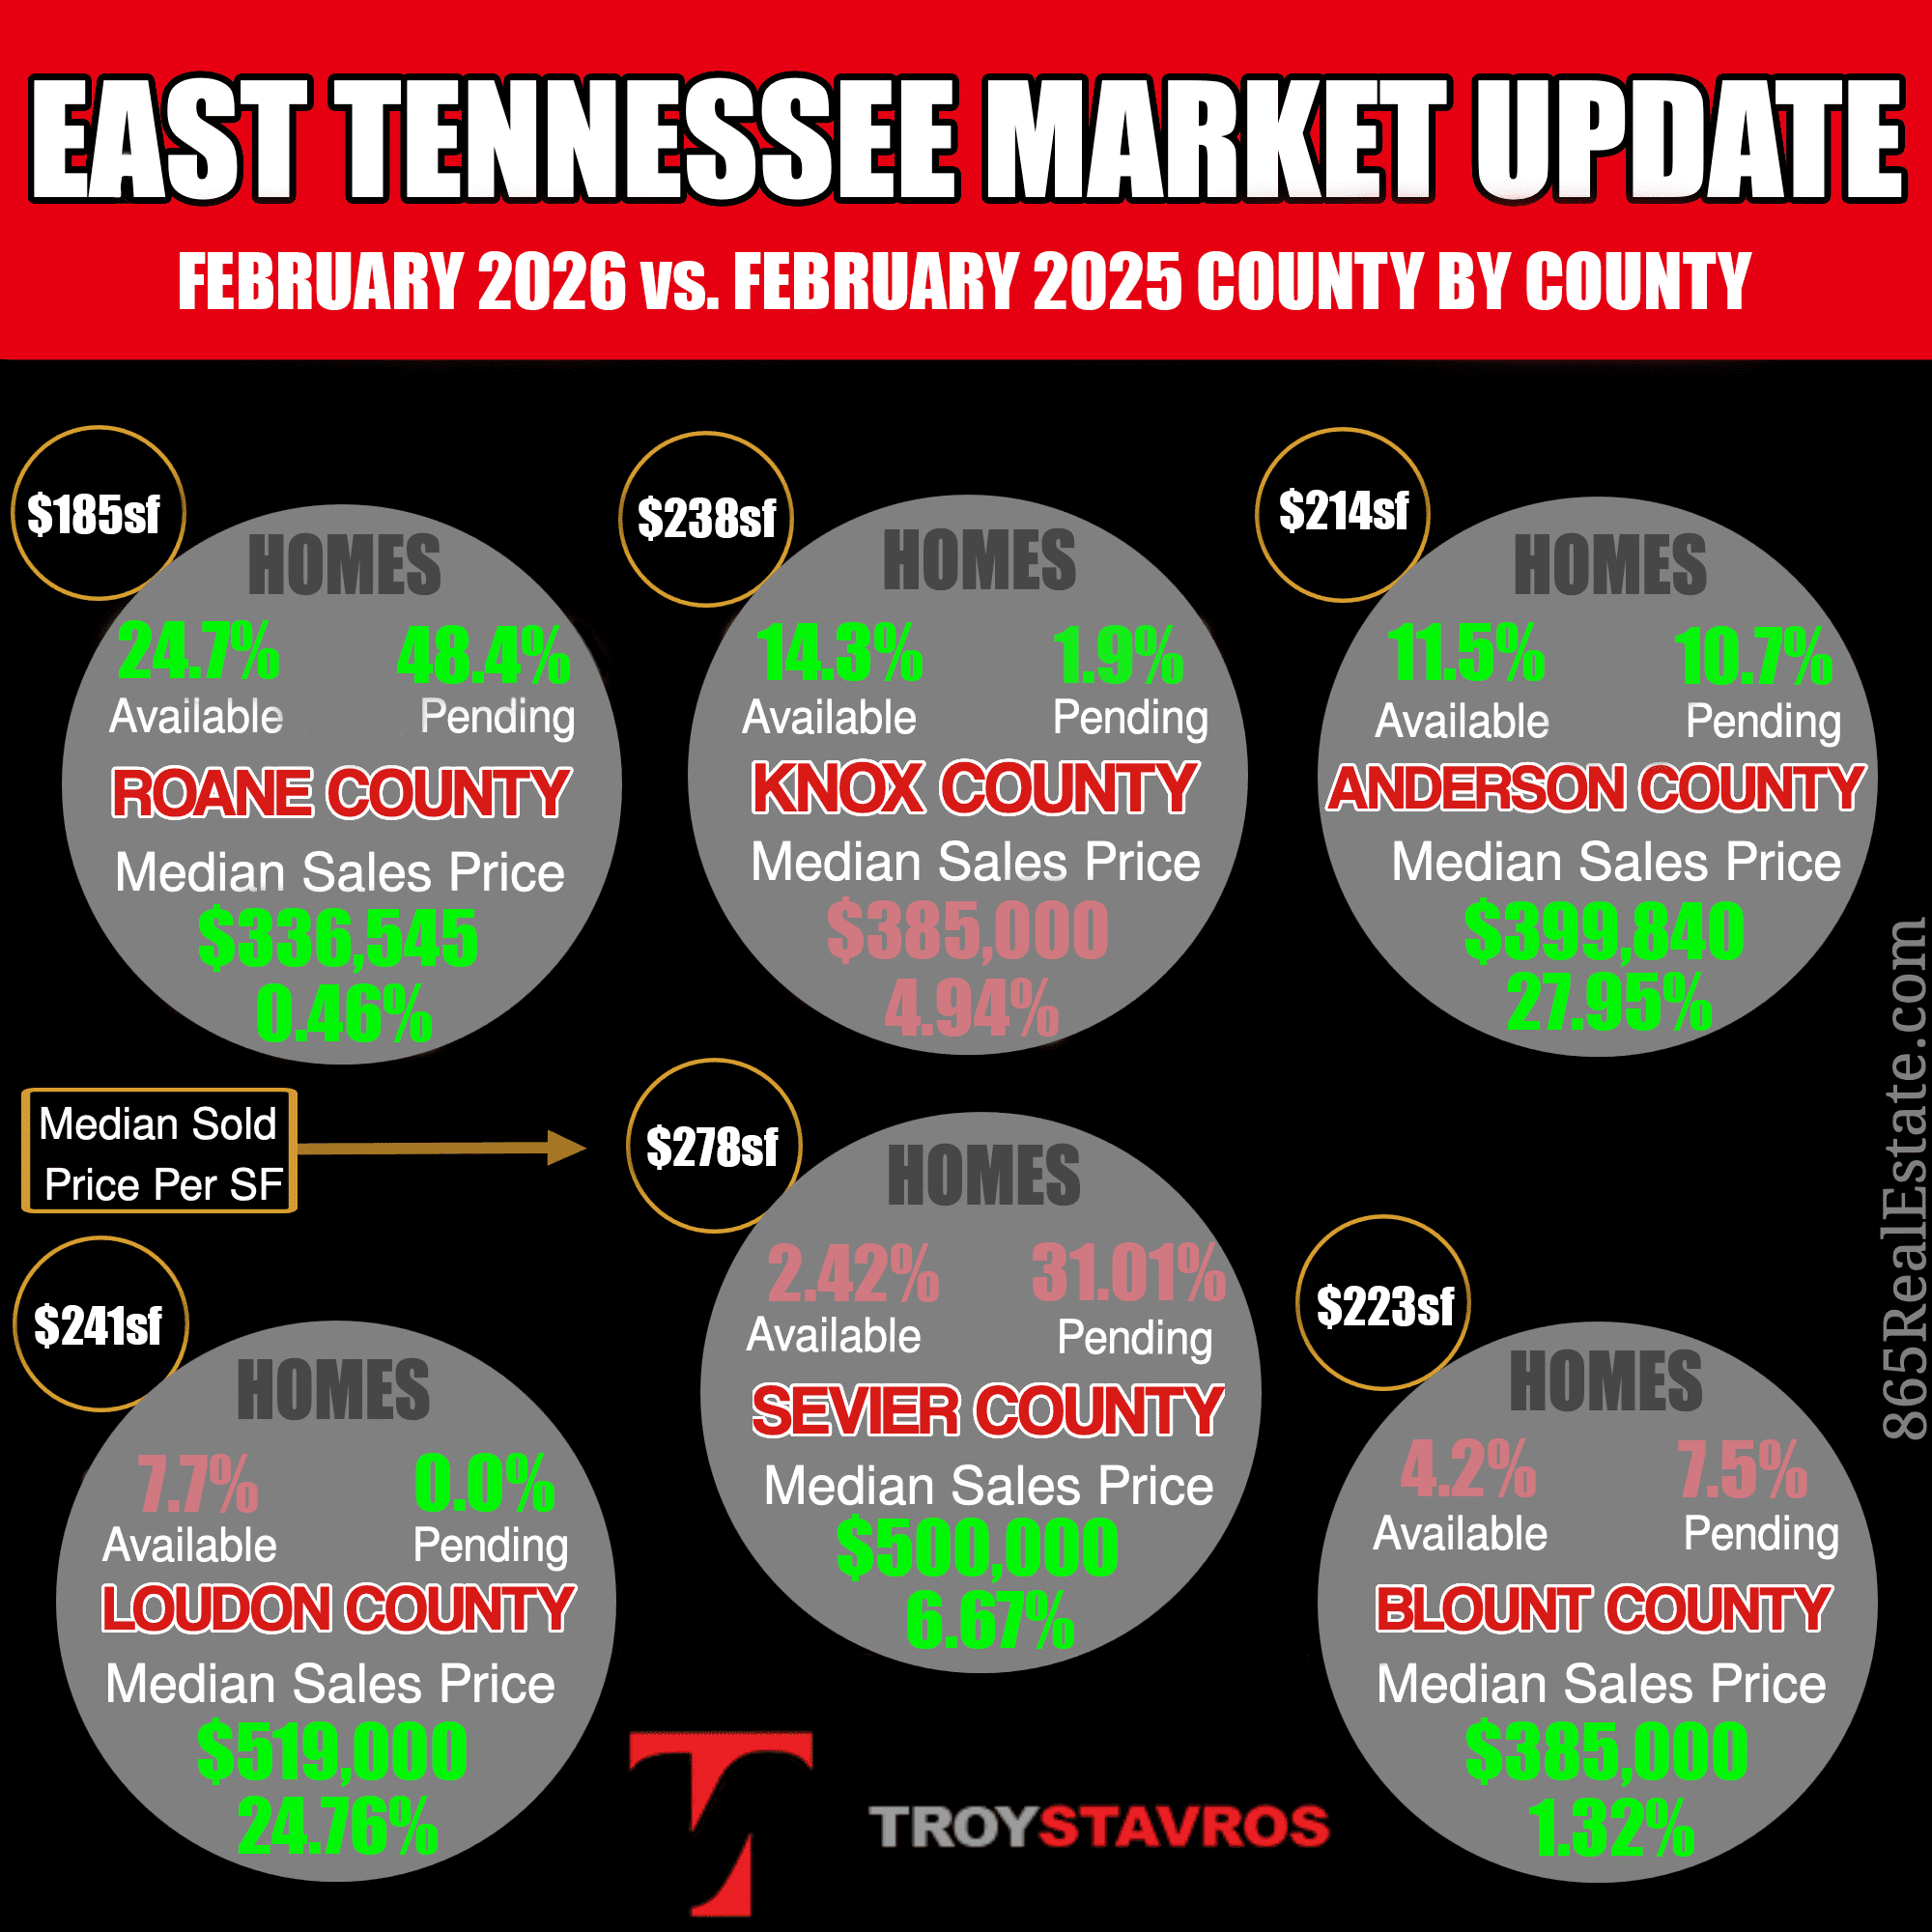
Anderson County’s closings surged 39.5% year over year — from approximately 43 homes in February 2025 to 60 in February 2026. Loudon County jumped 37.9%, from 58 closings to 80. Those are eye-popping numbers in isolation, but both counties operate at volumes where a dozen delayed closings sliding from January into February can dramatically swing the year-over-year comparison. In Anderson’s case, the entire 39.5% increase amounts to roughly 17 additional sales. In Loudon, it’s 22. These are markets where the weather delay alone can plausibly account for most, if not all, of the year-over-year increase.
Knox County’s 14.8% increase — from approximately 440 closings to 505 — is large enough that the storm effect alone cannot explain it. At Knox’s volume, even a meaningful number of delayed closings wouldn’t produce a nearly 15% swing. Knox’s growth reflects genuine demand, confirmed by the broader suite of metrics we’ll examine below.
Then there’s Blount County, where closings fell 25% year over year — from 152 to 114. In a market where every other demand indicator is pointing in the right direction, that decline requires a different explanation entirely.
Pending Sales: The Deceleration That Isn’t a Red Flag — With One Exception
In January, the pending sales data was the headline story. Knox County pending sales had surged 38.3%, and the broader East Tennessee regional figure was up 24.7%. Those numbers pointed unmistakably toward a spring surge in activity.
February’s pending data looks tamer by comparison. Across the broader East Tennessee region — encompassing all counties, not just our six-county service area — pending sales totaled 1,654 contracts, up 7% year over year. Knox County pending sales grew just 1.9%, a sharp deceleration from January’s explosive growth. On the surface, you might wonder whether the buyer momentum is fading.
It isn’t. What you’re seeing is normalization after an anomalous January. Last month’s pending surge was partly driven by storm-delayed contracts being executed once weather cleared and activity resumed. February’s numbers represent a return to a more sustainable growth trajectory — one that still points decisively upward. A 7% increase in regional pending activity, in a market that spent much of the past two years in contraction, is healthy and constructive. You don’t need 25% growth every month for the trend to be bullish. You need consistent positive direction, and that’s what February delivered.
Knox County’s 577 pending contracts account for roughly 35% of the entire East Tennessee regional pending total — a reflection of the outsized role Knox plays as the economic and population center of the region. That share has held remarkably consistent, reinforcing Knox’s position as the market’s gravitational center.
The exception, as always, is Sevier County. And this month, the exception got worse.
Sevier County’s Pending Sales Collapse: From Concerning to Critical
In January, Sevier County’s pending sales declined 11.15% year over year. That was bad. February’s number is worse — significantly worse. Pending sales in Sevier County fell 31% compared to February 2025.
Read that again: while every other county in the dataset posted flat or positive pending activity, and while the broader East Tennessee region as a whole grew 7%, Sevier County saw nearly a third of its buyer pipeline evaporate. This is not a data quirk. This is not a storm effect. This is a market telling you — loudly and clearly — that its correction is accelerating, not stabilizing.
The forward implications are stark. Pending sales are the most reliable leading indicator we have. If the pending pipeline is contracting by 31%, the closed sale numbers two and three months from now are going to reflect that contraction. The 16% increase in February closings — likely a byproduct of storm-delayed January deals finally reaching the closing table — should not be mistaken for evidence of a turnaround. The leading indicator is moving in the wrong direction, and it’s moving there faster than it was a month ago.
Mortgage Rates: The Tailwind Is Fading
As of mid-March 2026, the 30-year fixed mortgage rate has climbed to 6.29% — a 20-basis-point jump from the roughly 6.09% level that prevailed just weeks ago, and a meaningful departure from the sub-6% territory that many market participants had been hoping for by spring. The rate stability that served as a tailwind for the market through January and February is no longer something we can take for granted.
The catalyst is not a mystery. Crude oil has surged past $100 a barrel in the wake of the U.S. entry into the Iran conflict, and energy prices at that level feed directly into inflation expectations. Bond markets are repricing accordingly, and mortgage rates — which track the 10-year Treasury yield — are moving higher in response. Two weeks ago, the question was whether rates might drift back toward 5.75% by summer. Today, the question is whether they’ll hold below 6.5%.
To put the 6.29% rate in perspective: the demand recovery documented in January and February was built on rates near 6%. Every tenth of a percentage point above that level shrinks the qualified buyer pool. On a $350,000 home with 10% down, the difference between a 6.0% rate and a 6.29% rate adds roughly $60 to the monthly payment. That may sound modest in isolation, but for buyers at the margins of qualification — and there are many of them in East Tennessee — that $60 can be the difference between an approval and a denial. Scale that across thousands of potential buyers, and you begin to see how a seemingly small rate move can meaningfully alter market dynamics.
The volume and demand improvements we’ve documented over the past two months were real. But they were also rate-dependent. If rates continue climbing — and with oil above $100 and a military conflict showing no signs of rapid resolution, there is a credible path to 6.5% or higher — the spring market’s trajectory could look very different from what the February data was projecting.
The Three-Tier Framework: Same Structure, Shifting Dynamics
The three-tier classification of the East Tennessee market that we established in January still holds in February, but the internal dynamics within each tier are evolving.
The seller’s markets — Knox County at 2.37 months of supply, Blount County at 2.58, and Anderson County at 2.86 — remain firmly below the three-month threshold. Knox tightened from 2.63 months in January to 2.37 in February, reflecting both the surge in closings and the robust demand pipeline underneath.
The balanced markets — Loudon County at 3.43 months and Roane County at 3.45 — continue to sit in that equilibrium zone. But within this tier, Roane County delivered the single biggest surprise of the entire February dataset, which we’ll explore in detail below.
The buyer’s market — Sevier County at 7.72 months of supply — worsened from January’s already elevated 7.35 months. With pending activity collapsing and supply continuing to accumulate, Sevier remains in a category by itself, and the gap between it and the rest of the region is widening.
Knox County: The Engine Keeps Running
Knox County continues to be the gravitational center of the East Tennessee real estate market. The 505 closings in February represent a 14.8% year-over-year increase, the strongest growth rate of any county at meaningful volume. Absorption tightened to 2.37 months — the tightest level in at least a year, down from 2.63 months in January.
The pending-to-active ratio of 39.1% means that for every ten active listings, roughly four already have buyers under contract. That ratio has held remarkably consistent over the past two months, signaling sustained demand rather than a one-time spike. Knox accounts for approximately 35% of all pending activity across the broader East Tennessee region, continuing its role as the dominant engine of East Tennessee real estate.
Median days on market improved from 52 in January to 40 in February, indicating that well-priced homes are moving faster as spring approaches. The sold-to-original list price ratio of 95.9% is the second-best in the region, trailing only Blount, and the 2.2-percentage-point gap between original and final list price ratios tells us Knox sellers are generally pricing within a reasonable range of market value.
Knox’s pending growth did decelerate from January’s 38.3% to 1.9% in February, but as discussed above, this represents normalization, not retreat. The absolute volume of pending contracts — 577 — remains strong, and Knox’s spring is on track to be substantially more active than a year ago. The question now is whether the rate climb to 6.29% — and potentially higher — begins to erode that buyer momentum heading into April and May.
Blount County: Strongest Fundamentals, Most Puzzling Headline
If you only looked at one number, you’d think Blount County had a terrible February. Closings dropped 25% year over year, from 152 to 114. That’s the worst closed-sale performance of any county in the dataset.
And yet, by virtually every other metric, Blount County is the best-performing market in East Tennessee — just as it was in January.
The median days on market in Blount is 28 days, the fastest of any county by a wide margin. The sold-to-original list price ratio of 96.1% is the highest in the region, meaning Blount sellers are pricing their homes more accurately than sellers in any other county. The gap between original list price and final sale price is just 1.9 percentage points — the tightest in the dataset — confirming that sellers here are not engaging in the list-high-and-cut strategy that inflates days on market and erodes negotiating leverage. Absorption sits at 2.58 months, the second-tightest in the region behind Knox.
So why did closings fall 25%? The same explanation applies here that it did in January, only more emphatically: Blount County does not have a demand problem. It has a supply problem. When homes are selling in 28 days and sellers are receiving 96.1% of their original asking price, the constraint is not on the buy side. The constraint is that there simply aren’t enough homes coming to market to sell. The 7.5% decline in pending sales — the only county besides Sevier to show a pending decline — further supports this interpretation. If there aren’t enough active listings, there can’t be enough pending contracts, and there can’t be enough closings. It’s a supply bottleneck, not a demand shortfall.
For Blount County sellers who have been waiting for the right time to list, the data is sending a clear message: the market wants your home.
Anderson County: Strong Numbers, Storm-Sized Asterisk
Anderson County’s 39.5% increase in closed sales — from approximately 43 to 60 — is the largest year-over-year percentage gain of any county. Combined with a 10.7% increase in pending sales and 2.86 months of supply, the fundamental picture is solidly in seller’s market territory.
However, at Anderson’s volume, the storm effect is nearly impossible to separate from the underlying trend. The entire year-over-year gain is roughly 17 sales. If even half of those are January closings that were delayed by weather, the organic growth rate falls to approximately 20%, which is still strong but tells a meaningfully different story. Trend data in Anderson will become more reliable once we have a month of closings that isn’t contaminated by storm-delayed activity.
The metric that continues to demand attention in Anderson is the pricing gap. Sellers are receiving 92.9% of their original asking price — a 7.1-percentage-point discount from where they started. That’s the second-worst performance on this metric in the dataset, trailing only Sevier. Anderson sellers are still overpricing, and in a market that processes only 60 sales a month, an overpriced listing doesn’t just sit — it becomes stale. Pricing discipline matters everywhere, but it matters more in Anderson than in Knox or Blount because the margin for error is so much thinner.
Loudon County: Storm-Inflated Closings, but the Foundation Is Solid
Loudon County’s 37.9% jump in closings — from 58 to 80 — is almost certainly amplified by storm-delayed January activity. Pending sales were perfectly flat year over year, and absorption at 3.43 months sits squarely in balanced territory, essentially unchanged from January’s 3.58 months.
The outlier metric in Loudon this month is the 65-day median days on market, a significant increase from January’s 42 days. Storm-delayed closings are the most likely culprit here as well. Homes that should have closed in late January but didn’t finalize until February would naturally carry a longer days-on-market figure, dragging up the county median. This should normalize in March as the storm’s ripple effects fully clear the pipeline.
The pricing data reveals a growing gap between seller expectations and buyer reality. The sold-to-original list price ratio of 93.4% means Loudon sellers are surrendering 6.6 percentage points from their original asking price — a gap exceeded only by Anderson and Sevier. The 4.1-percentage-point spread between original and final list price ratios indicates that much of this discount is happening through price reductions before offers are even received. Loudon sellers should take note: in a balanced market with adequate supply, overpricing doesn’t create leverage. It creates days on market.
Roane County: The Turnaround Nobody Saw Coming
Last month, I wrote that Roane County was the market that most concerned me heading into the second quarter. The data supported that concern — Roane had the worst sold-to-original list price ratio in the entire region at 91.5%, a weak pending-to-active ratio of 25.8%, and a trajectory that suggested it could slip from balanced territory into something less favorable.
One month later, Roane County has delivered the single most dramatic turnaround in the February dataset.
Pending sales surged 48.4% year over year — not only the largest increase of any county, but nearly seven times the broader regional average of 7%. The pending-to-active ratio jumped from 25.8% to 40.1%, which is now the highest in the entire six-county dataset — higher than Knox, higher than Blount, higher even than Anderson. The sold-to-original list price ratio improved from 91.5% to 95.2%, a 3.7-percentage-point leap that moves Roane from worst in the region to third-best. Absorption tightened from 3.68 to 3.45 months.
The one lagging indicator is closed sales, which grew only 1.8% year over year — the weakest growth in the dataset. But that’s the nature of leading versus trailing indicators. The pending surge hasn’t had time to flow through to closings yet. If March and April closings reflect even a fraction of February’s pending pipeline, Roane’s closed-sale trajectory is about to inflect sharply upward.
So what happened? The most likely explanation is that the demand wave from lower mortgage rates, which first hit Knox and Blount, has now reached Roane with a lag. Roane’s lower price points make it particularly sensitive to rate changes — the same monthly savings that brings a Knox buyer off the sidelines can make the difference between qualifying and not qualifying for a Roane buyer. It’s also possible that sellers in Roane have begun pricing more realistically, as the significant improvement in sold-to-original list price ratio suggests. Better pricing attracts more offers, which shortens days on market, which improves every downstream metric.
One month does not make a trend, and I want to be clear-eyed about that. Roane’s closed-sale growth is still the weakest in the region at 1.8%, and the county’s relatively small volume makes it susceptible to month-to-month noise. But the direction of every leading indicator shifted decisively positive in February, and that is a material change from where Roane stood 30 days ago. The concern now is that Roane’s rate sensitivity cuts both ways — the same affordability dynamics that pulled buyers in at 6% could push them back out if rates continue climbing toward 6.5%.
Sevier County: The Correction Deepens
If Roane County is the story of a market finding its footing, Sevier County is the story of a market still losing its grip.
Every critical forward-looking indicator moved in the wrong direction in February. Active listings climbed to 1,606. The absorption rate worsened to 7.72 months, up from January’s already elevated 7.35 — now approaching eight months of supply. The pending-to-active ratio collapsed to 14.8%, meaning that for roughly every seven listings on the market, only one has a buyer under contract.
The 31% decline in pending sales is the number that should define how we think about Sevier County’s trajectory heading into spring. In January, pending activity was down 11.15%. Now it’s down 31%. The decline is not flattening. It is accelerating. And this is happening in a rate environment that is pulling buyers off the sidelines everywhere else in the region.
The 16% increase in February closings — 140 sales versus approximately 121 a year ago — will tempt some to find a silver lining. Don’t. Those closings represent contracts that were written weeks or months ago, many of which were likely delayed from January by the winter storm. They tell us about the past. Pending sales tell us about the future. And the future that the pending data is pointing toward is more supply, fewer buyers, and continued downward pressure on pricing.
Sevier County sellers are currently receiving 92.1% of their original asking price, with a 3.1-percentage-point gap between original and final list price ratios. On a $500,000 cabin listing — a common price point in the Sevier market — that translates to selling for roughly $460,500, nearly $40,000 below the original asking price. And with pending activity in freefall, the sellers who are still holding firm on aspirational pricing are going to find themselves waiting well beyond the current 92-day median.
The structural oversupply problem identified in January — driven by the unwinding of the short-term rental investment boom — has not improved. Sevier County continues to carry nearly as much active inventory as Knox County despite a fraction of the population and a fraction of the organic housing demand. Until either supply contracts significantly through price reductions that attract bargain-hunting buyers, or a genuinely new source of demand materializes, this market has further to fall.
The Iran Variable: What Conflict Means for East Tennessee Real Estate
On February 28th, the United States entered into armed conflict in Iran, introducing a significant new variable into the economic and housing outlook. While the conflict had no impact whatsoever on February’s housing data — it began on the month’s final day — its potential to reshape the spring market is no longer theoretical. It is already happening.
Crude oil has surged past $100 a barrel, a level not seen in over a year, and the ripple effects are arriving exactly where economists predicted they would. Energy prices at this level feed directly into inflation expectations across the economy — from transportation costs to manufacturing inputs to the price of groceries. Bond markets, which price in future inflation, have responded by pushing yields higher. And mortgage rates, which are tethered to the 10-year Treasury yield, have followed: the 30-year fixed rate has jumped to 6.29%, up 20 basis points in a matter of weeks.
This is how geopolitical conflict transmits into your monthly mortgage payment.
The concern is not just the rate move that has already occurred, but where rates go from here. If crude oil remains above $100 — and with an active military conflict in a major oil-producing region, there is no obvious catalyst for a rapid decline — inflationary pressure will persist. If inflation expectations continue to rise, the Federal Reserve’s path toward further rate cuts becomes more constrained, and mortgage rates could push toward 6.5% or beyond. The rate environment that fueled the demand recovery of late 2025 and early 2026 is not guaranteed to hold.
Beyond rates, there is the confidence channel. Consumers facing geopolitical uncertainty tend to defer large financial commitments. A home purchase is the largest financial commitment most people will ever make, and even if rates stabilize at 6.29%, a prolonged conflict could introduce the same kind of buyer hesitation that characterized the rate-shock period of 2023 and 2024 — not because the math doesn’t work, but because the uncertainty makes people reluctant to act.
There is a counterargument worth acknowledging. Real estate has historically been viewed as a tangible, inflation-hedging asset during periods of geopolitical instability. Some buyers may accelerate their purchase timelines specifically because they want the perceived safety and stability of homeownership during uncertain times. And the East Tennessee market, with its relatively affordable price points and strong population growth fundamentals, is better positioned than many regions to weather external shocks.
The honest assessment is this: nobody knows how the conflict will unfold, how long it will last, or how deeply it will affect domestic economic conditions. What we know right now is that rates have already moved against buyers, oil prices have already moved against inflation expectations, and the comfortable assumptions of 30 days ago — that rates would hold near 6% or drift lower — are no longer operative. The data from February still tells us this market was on solid footing heading into spring. The question is how much of that footing erodes if the macroeconomic ground keeps shifting.
What This Means for Sellers in the Knoxville and East Tennessee Market
The message to sellers this month is both encouraging and urgent — and the urgency has increased since last month.
Encouraging because demand is real. Across most of the region, buyers are active, pending sales are growing, and absorption rates are tightening. If you’re in Knox, Blount, or Anderson, you are in a seller’s market with genuine competitive dynamics working in your favor.
Urgent because the window may be closing faster than expected. Mortgage rates have already climbed 20 basis points in a matter of weeks. Oil is above $100. A military conflict is underway with no clear timeline for resolution. None of this means the market is about to collapse — the supply fundamentals in the core counties are too tight for that. But it does mean that the conditions sellers are enjoying right now — strong buyer demand, favorable rates, and positive momentum — are not guaranteed to persist through the summer. Sellers who have been waiting for prices to climb higher are making a bet that the favorable conditions of the past few months will continue despite a fundamentally altered macroeconomic backdrop. That is a riskier bet today than it was 30 days ago, and it was a riskier bet 30 days ago than it was 60 days ago.
If you’re planning to sell in 2026, there’s a strong argument that the spring window — right now — offers the most favorable combination of demand, rates, and buyer activity that you’re likely to see this year.
Pricing discipline remains paramount. The spread between the best and worst sold-to-original list price ratios in February is 4.0 percentage points — Blount’s 96.1% versus Sevier’s 92.1%. On a $400,000 home, that gap represents $16,000. The counties where sellers price accurately — Blount and Knox — are the counties where homes sell fastest and where sellers retain the most value. That correlation has been consistent across every month of data I’ve analyzed, and it is not a coincidence. In a rate environment that is moving against buyers, pricing accuracy becomes even more critical — an overpriced listing that might have eventually attracted an offer at 6% may simply expire at 6.5%.
What This Means for Buyers in the Knoxville and East Tennessee Market
For buyers, February’s data reinforces the geographic divergence that has defined this market for months — but the rate move adds a new layer of urgency across the board.
In Knox County and Blount County, you are competing for limited inventory in a tightening market. Sub-three-month supply, fast days on market, and strong pending pipelines mean that hesitation costs you homes. Come prepared, come pre-approved, and come realistic about pricing. A market with 2.37 months of supply and a 39% pending-to-active ratio is not the market for contingency-laden, below-asking offers.
In Sevier County, the negotiating leverage continues to shift in the buyer’s direction — and the shift is accelerating. With pending activity down 31%, supply approaching eight months, and sellers already accepting 92.1% of original asking prices, the room to negotiate is significant and growing. For buyers with a long-term investment horizon and the patience to weather a market that has likely not yet bottomed, Sevier County’s pricing becomes more compelling with each passing month. But enter with eyes wide open — the pending data is telling us this correction has further to run.
Roane County, which looked like a cautionary tale four weeks ago, is now worth a second look. The 48.4% surge in pending activity and improved pricing metrics suggest that Roane may be entering a more competitive phase. Buyers who were enjoying relatively relaxed conditions in Roane should be aware that the dynamics are shifting — though rising rates could moderate that shift if they begin to push Roane’s rate-sensitive buyers back to the sidelines.
The wildcard for buyers across all markets is the rate trajectory. At 6.29% and climbing, the math is getting tighter for many households. Waiting for rates to fall further — a strategy that worked beautifully in late 2025 — now carries substantially more risk. With oil above $100 and a military conflict introducing persistent inflationary pressure, the next move in rates is more likely to be up than down in the near term. Buyers who are qualified and ready today should weigh the cost of waiting not just against the possibility of lower rates, but against the increasingly real possibility of higher ones. Locking in at 6.29% may feel disappointing compared to the 6% that was available weeks ago, but it could look attractive compared to what’s available in June.
Spring 2026 Forecast: The Window Narrows
Heading into January, the story was straightforward: rates were improving, buyers were returning, and the spring setup looked favorable across most of the region. Heading into March, the story has grown considerably more complicated — and the complications are arriving faster than anticipated.
The domestic fundamentals of the East Tennessee housing market have not changed. Demand is positive. Absorption is healthy in most counties. Pending activity is growing. The seller’s market counties are tightening. Even Roane County, last month’s biggest concern, is showing genuine signs of life.
But the external environment is deteriorating in real time. Crude oil above $100. Mortgage rates at 6.29% and rising. An active military conflict in a major oil-producing region with no clear exit strategy. The housing market doesn’t exist in a vacuum, and macroeconomic shocks have a way of rippling through real estate markets with a lag of roughly 60 to 90 days. The shock began on February 28th. By late April or May, we’ll know whether it was a temporary disruption or a structural shift in the rate and inflation landscape.
The spring forecast, then, is this: if rates stabilize near 6.29% and do not climb meaningfully higher, the East Tennessee market — outside of Sevier County — still has the fundamentals to deliver a solid spring. The pending data supports that. The absorption data supports that. The supply constraints in Knox, Blount, and Anderson are real enough to prevent a significant slowdown even with modestly higher rates.
If rates push past 6.5% — which is a realistic scenario if oil remains above $100 and inflation expectations continue to rise — the spring could look very different. Not a collapse in the core counties, where supply is too tight for that, but a meaningful deceleration of the momentum that has been building since late 2025. The buyer pool that returned to the market at 6% is not the same buyer pool that remains at 6.75%. Every quarter-point increase thins the herd.
Sevier County’s spring is going to be difficult regardless of what happens with rates or geopolitics. A market with nearly eight months of supply and an accelerating decline in buyer activity does not need an external shock to continue correcting. It’s doing that on its own. Rising rates only make it worse, as they erode the purchasing power of the bargain hunters and investors who represent Sevier’s best near-term hope for demand.
The advice for everyone operating in this market — buyers, sellers, agents, and investors — is the same as it’s been, just with added emphasis: know which market you’re in, price to reality, and don’t build your strategy on assumptions that require everything to break in your favor. The February data tells us where this market was heading. The March rate environment tells us that the path just got steeper. The window for action hasn’t closed — but it is narrower than it was a month ago, and it may be narrower still a month from now.