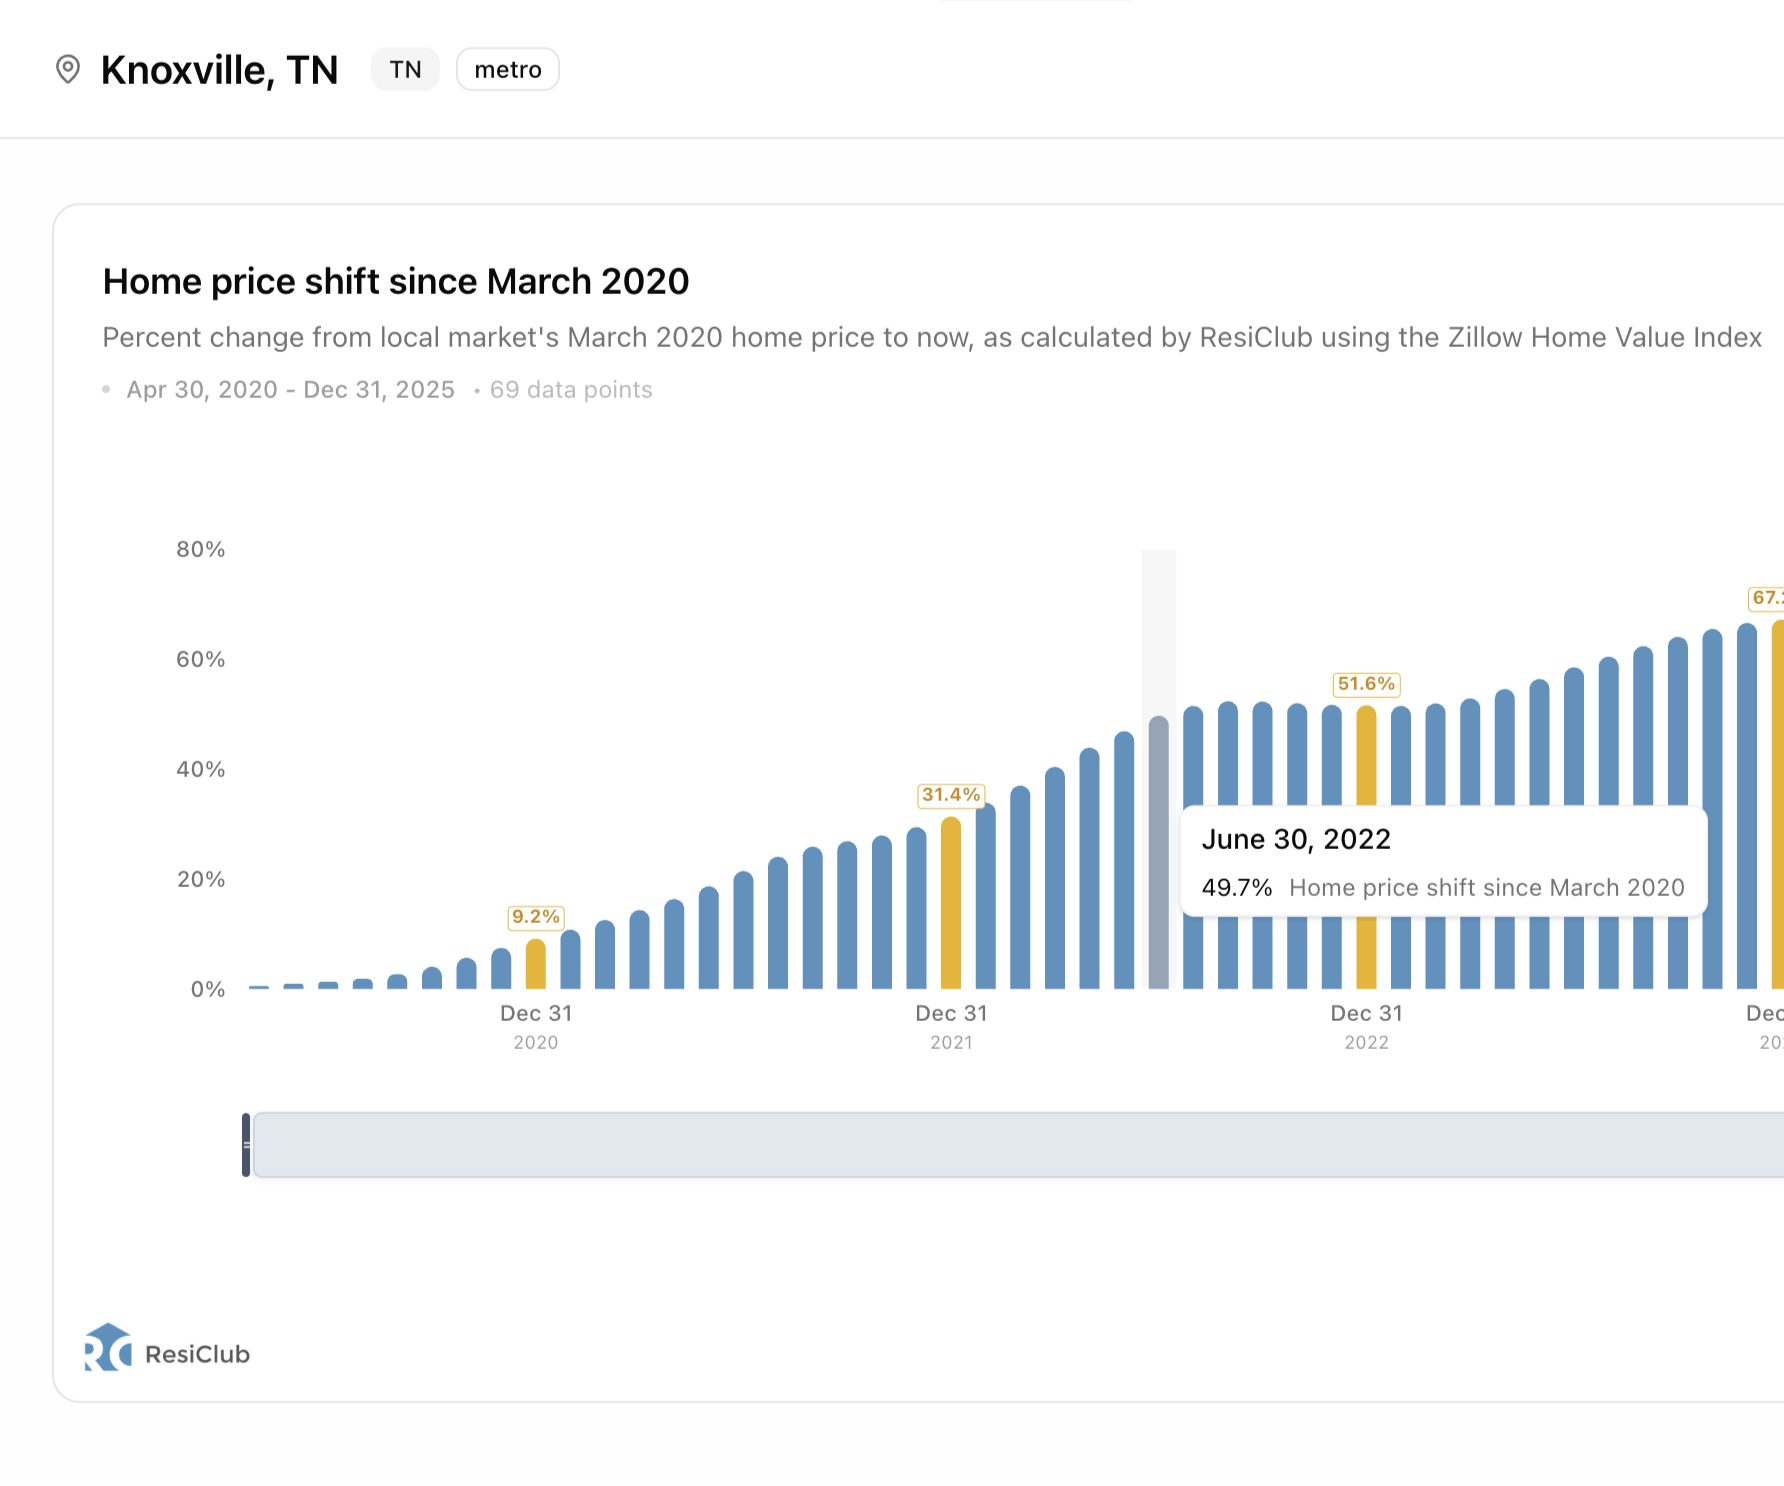
The Big Picture: Rates Are Flat, But Inflation Is Not
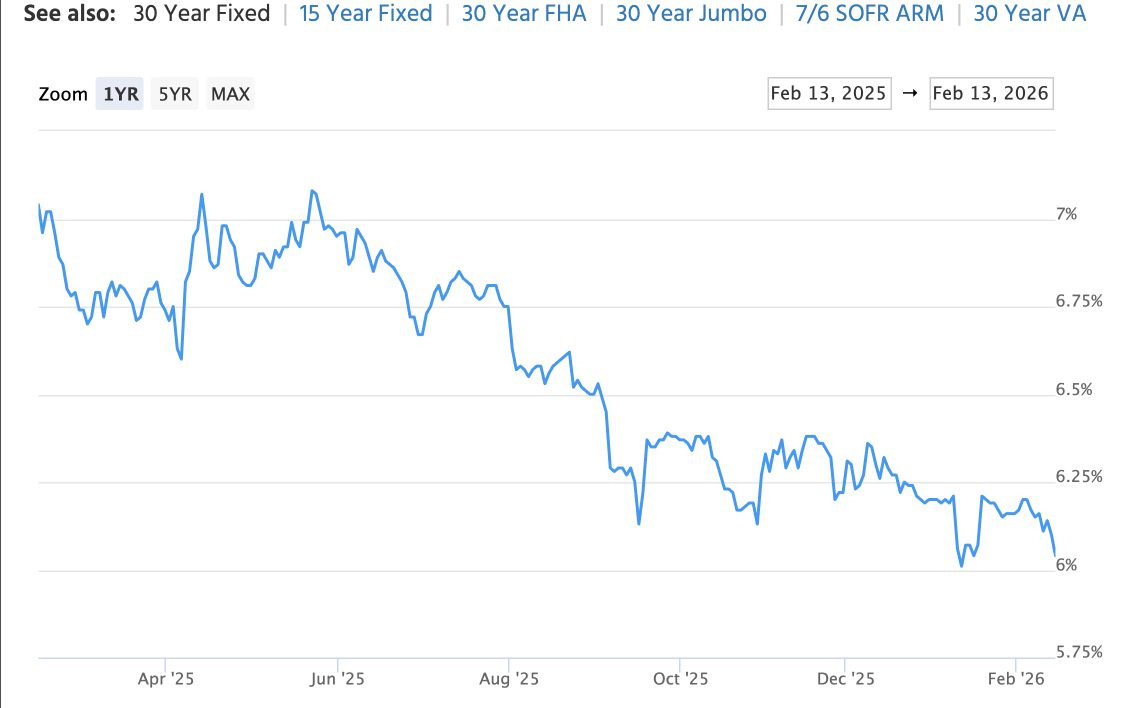
The East Tennessee housing market enters the summer of 2026 in a state of productive tension. The 30-year fixed mortgage rate sits at 6.68%, essentially flat month over month, and that stability has been quietly beneficial. Buyers and sellers have stopped waiting for a dramatic rate drop and started making decisions based on current conditions. Deals are getting done — not because the market is easy, but because expectations have finally calibrated to reality.
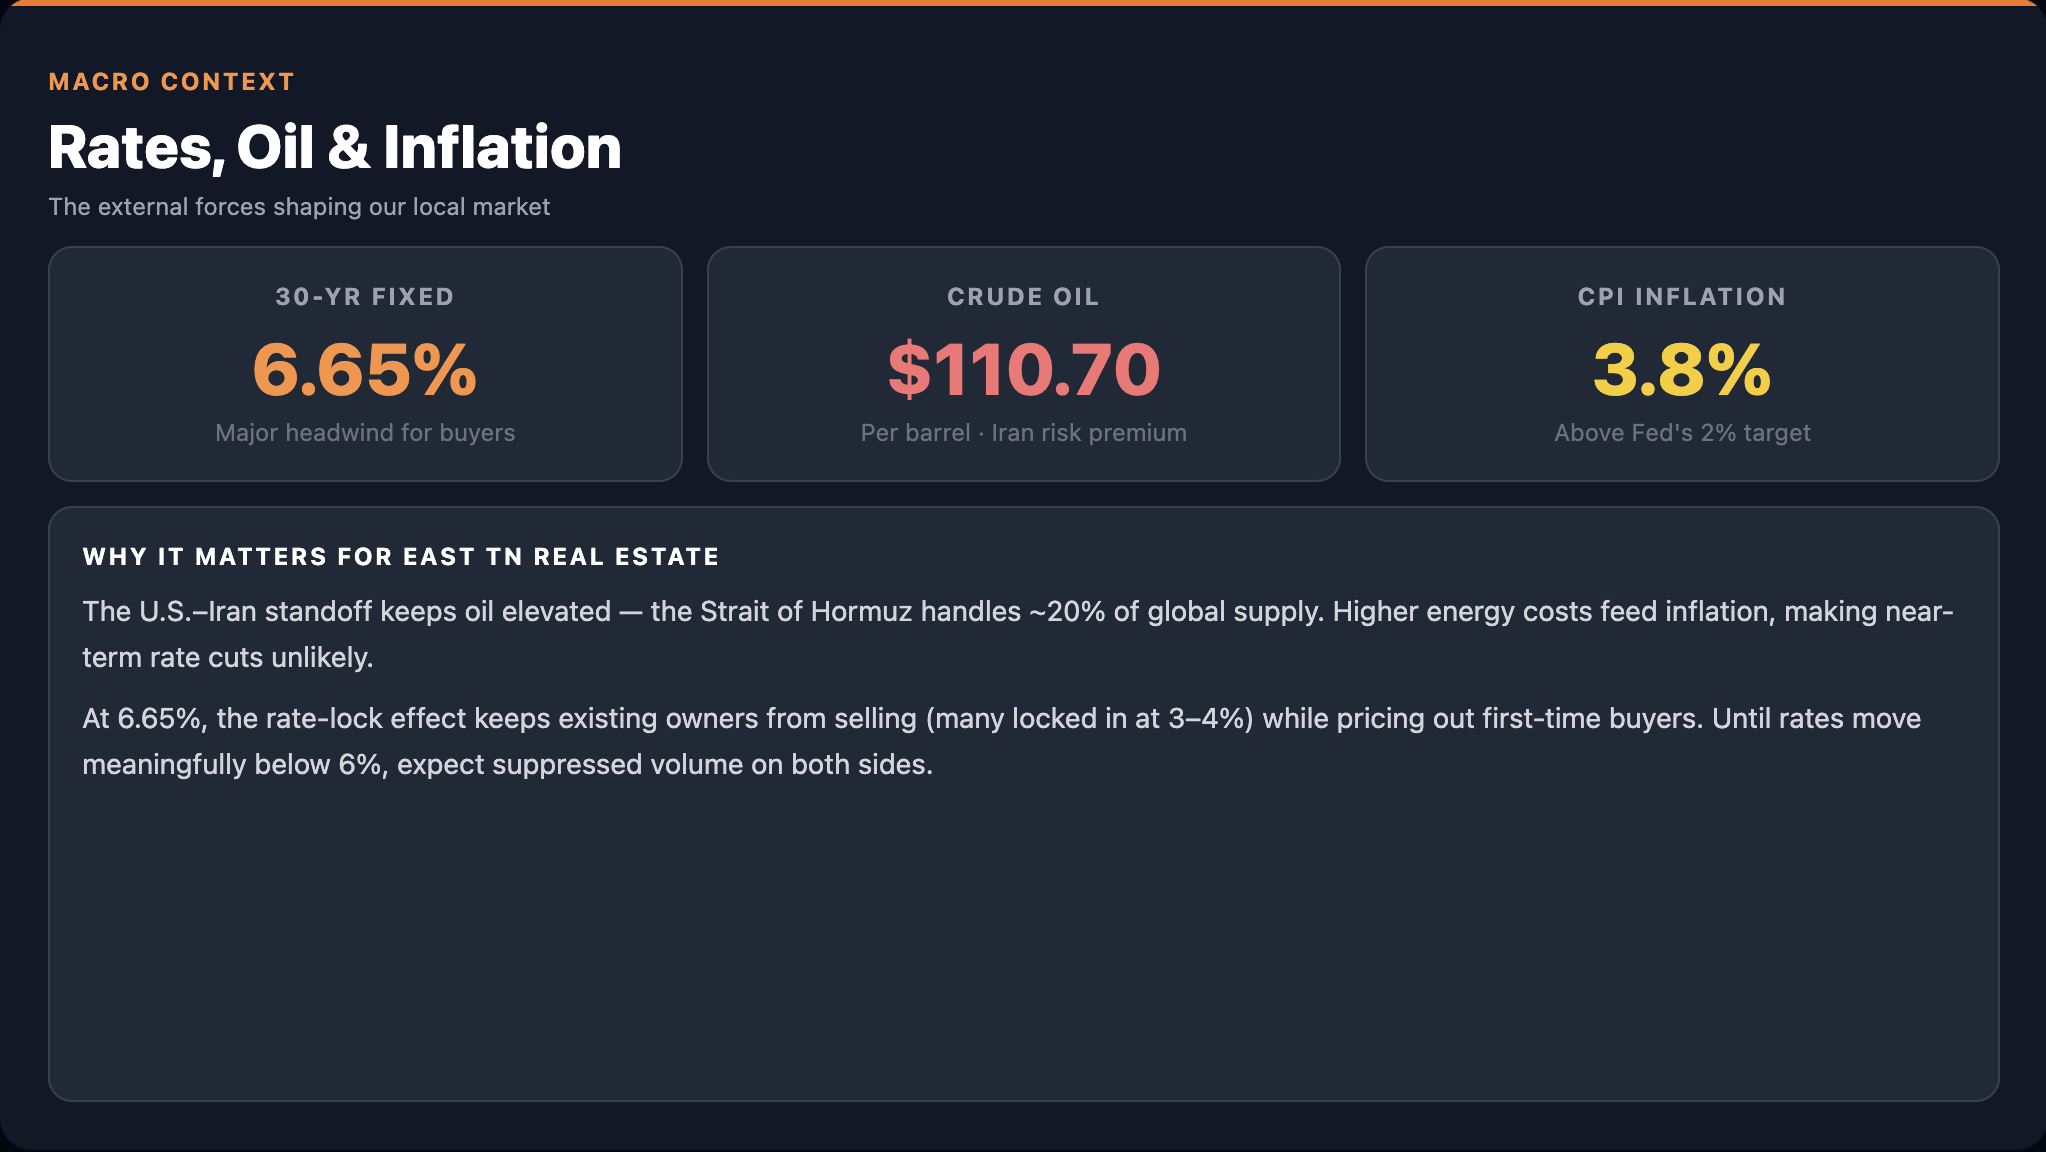
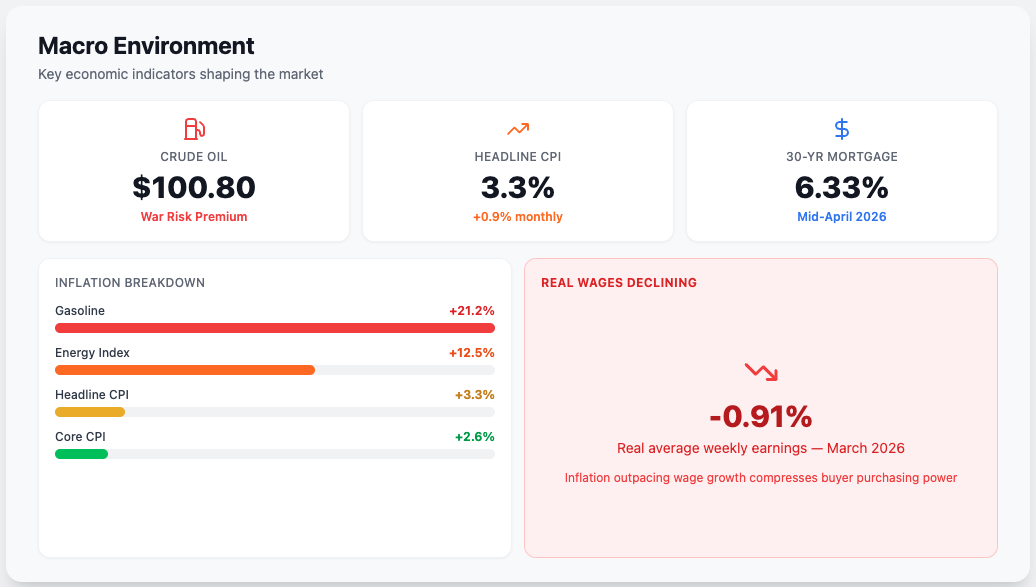
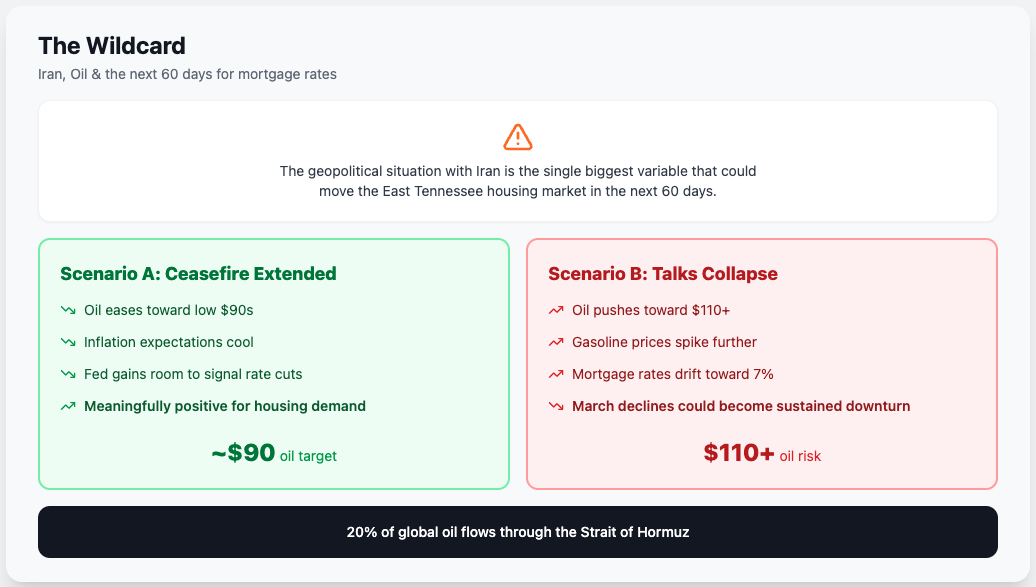
That said, the broader economic backdrop is growing more complicated, not less. Brent crude oil has climbed to $94.27 per barrel, a figure that ripples through every corner of the housing economy. Petroleum is embedded in shingles, PVC piping, asphalt driveways, transportation logistics, and virtually every building material that arrives on a job site. When oil prices rise, construction costs follow, and those costs ultimately land on the buyer’s doorstep.
The real headline, however, is inflation. The Consumer Price Index surged to 4.2%, up from 3.8% in the prior report. Core CPI — which strips out volatile food and energy costs — ticked up to 2.9% from 2.8%. The Federal Reserve’s target remains 2.0%, and the gap between where inflation is and where it needs to be is widening, not narrowing. The spread between headline CPI and core CPI expanded from 1.0% to 1.3%, meaning food and energy costs are re-accelerating at a pace that directly compresses household buying power.
For anyone hoping that rate cuts would arrive in 2026 and unlock a wave of affordability, the data tells a different story. With inflation moving in the wrong direction, the probability of Fed rate cuts this year has dropped significantly. The current hold could extend well into 2027, and buyers and sellers in East Tennessee should plan for mortgage rates to remain in the mid-to-upper 6% range — with the possibility of testing 7% if inflationary pressures persist.
The Lock-In Effect: Why Inventory Remains Tight
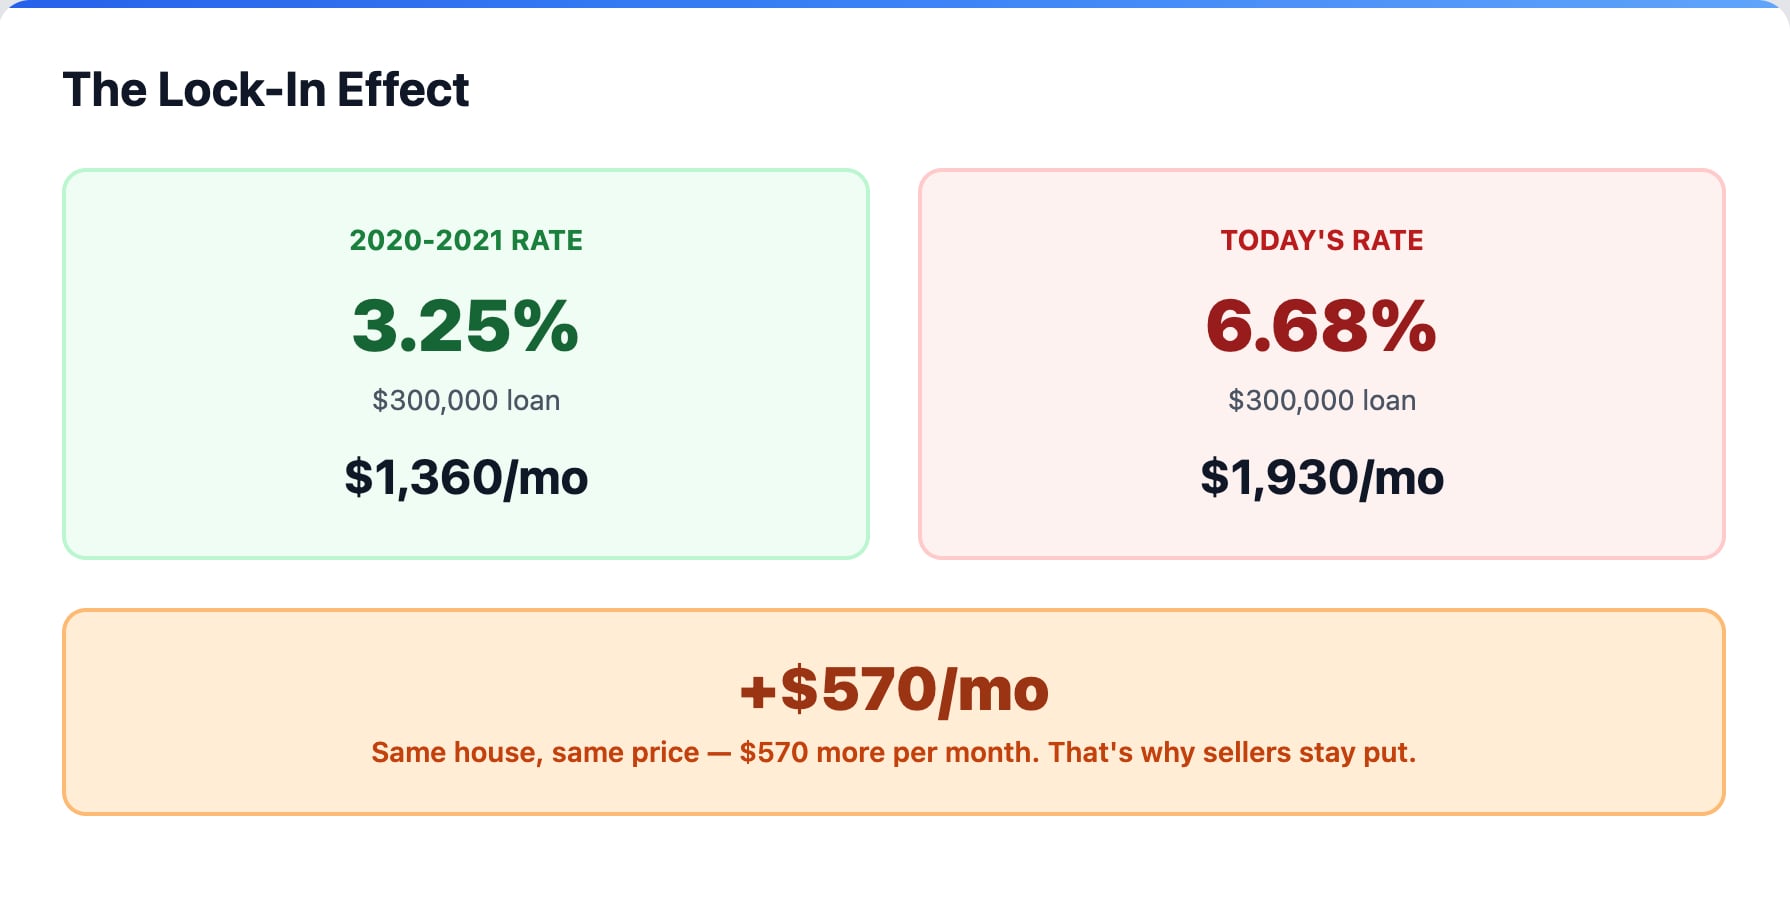
One of the most powerful forces shaping the East Tennessee real estate market right now is the lock-in effect, and it shows no signs of loosening. A homeowner who secured a 3.25% mortgage rate in 2020 or 2021 on a $300,000 loan is paying roughly $1,360 per month. That same loan at today’s 6.68% rate would cost approximately $1,930 per month — a difference of $570 every single month for the exact same house at the exact same price.
That math is why so many potential sellers are staying put. Moving to an equivalent or even slightly better home would mean a dramatically higher monthly payment, and for most households, that trade simply doesn’t make financial sense. The result is a persistent shortage of new listings across most East Tennessee markets, which continues to support prices even as affordability pressure mounts. Until rates drop meaningfully — and the data suggests that won’t happen soon — the lock-in effect will remain the invisible hand constraining supply throughout the region.
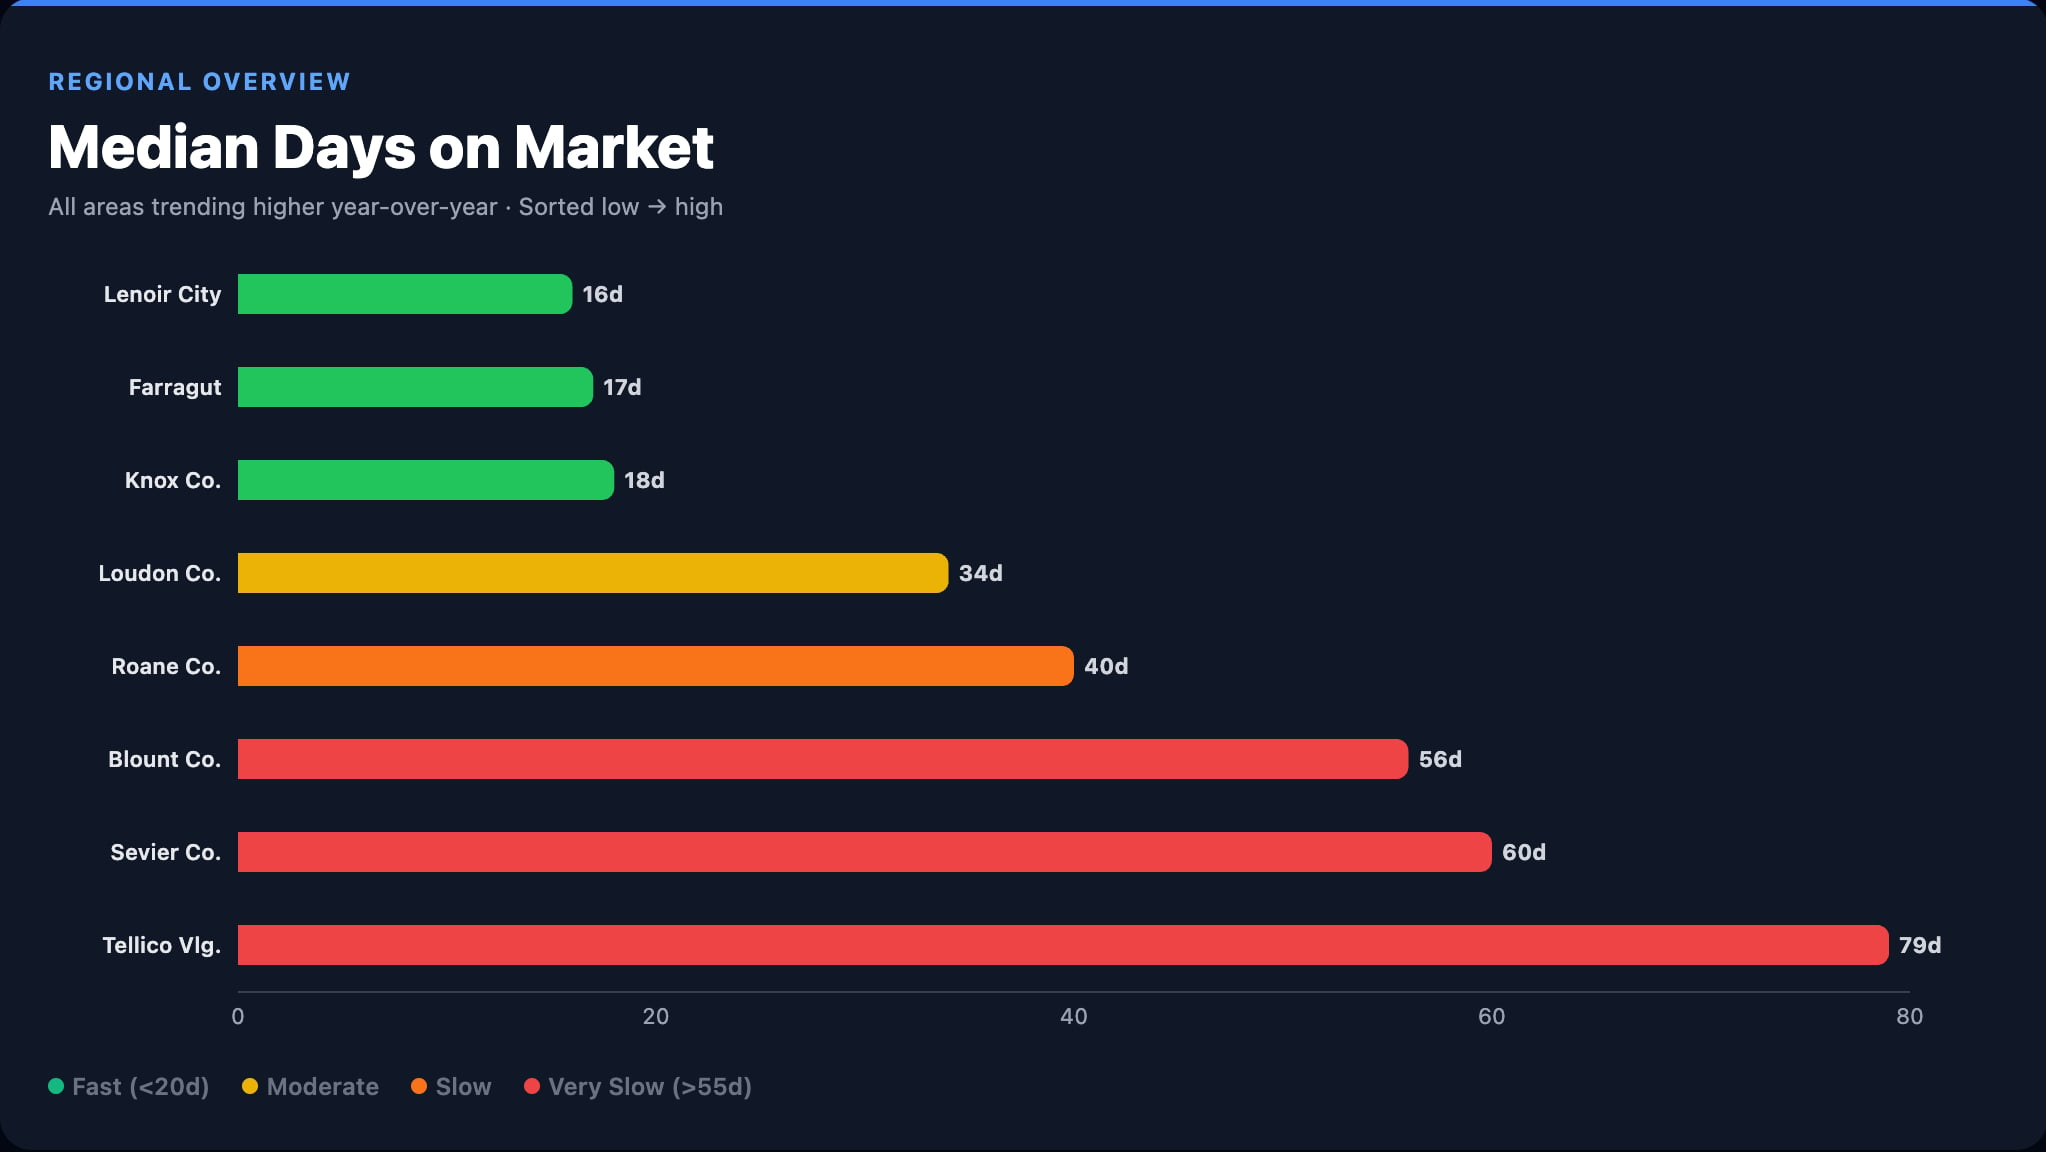
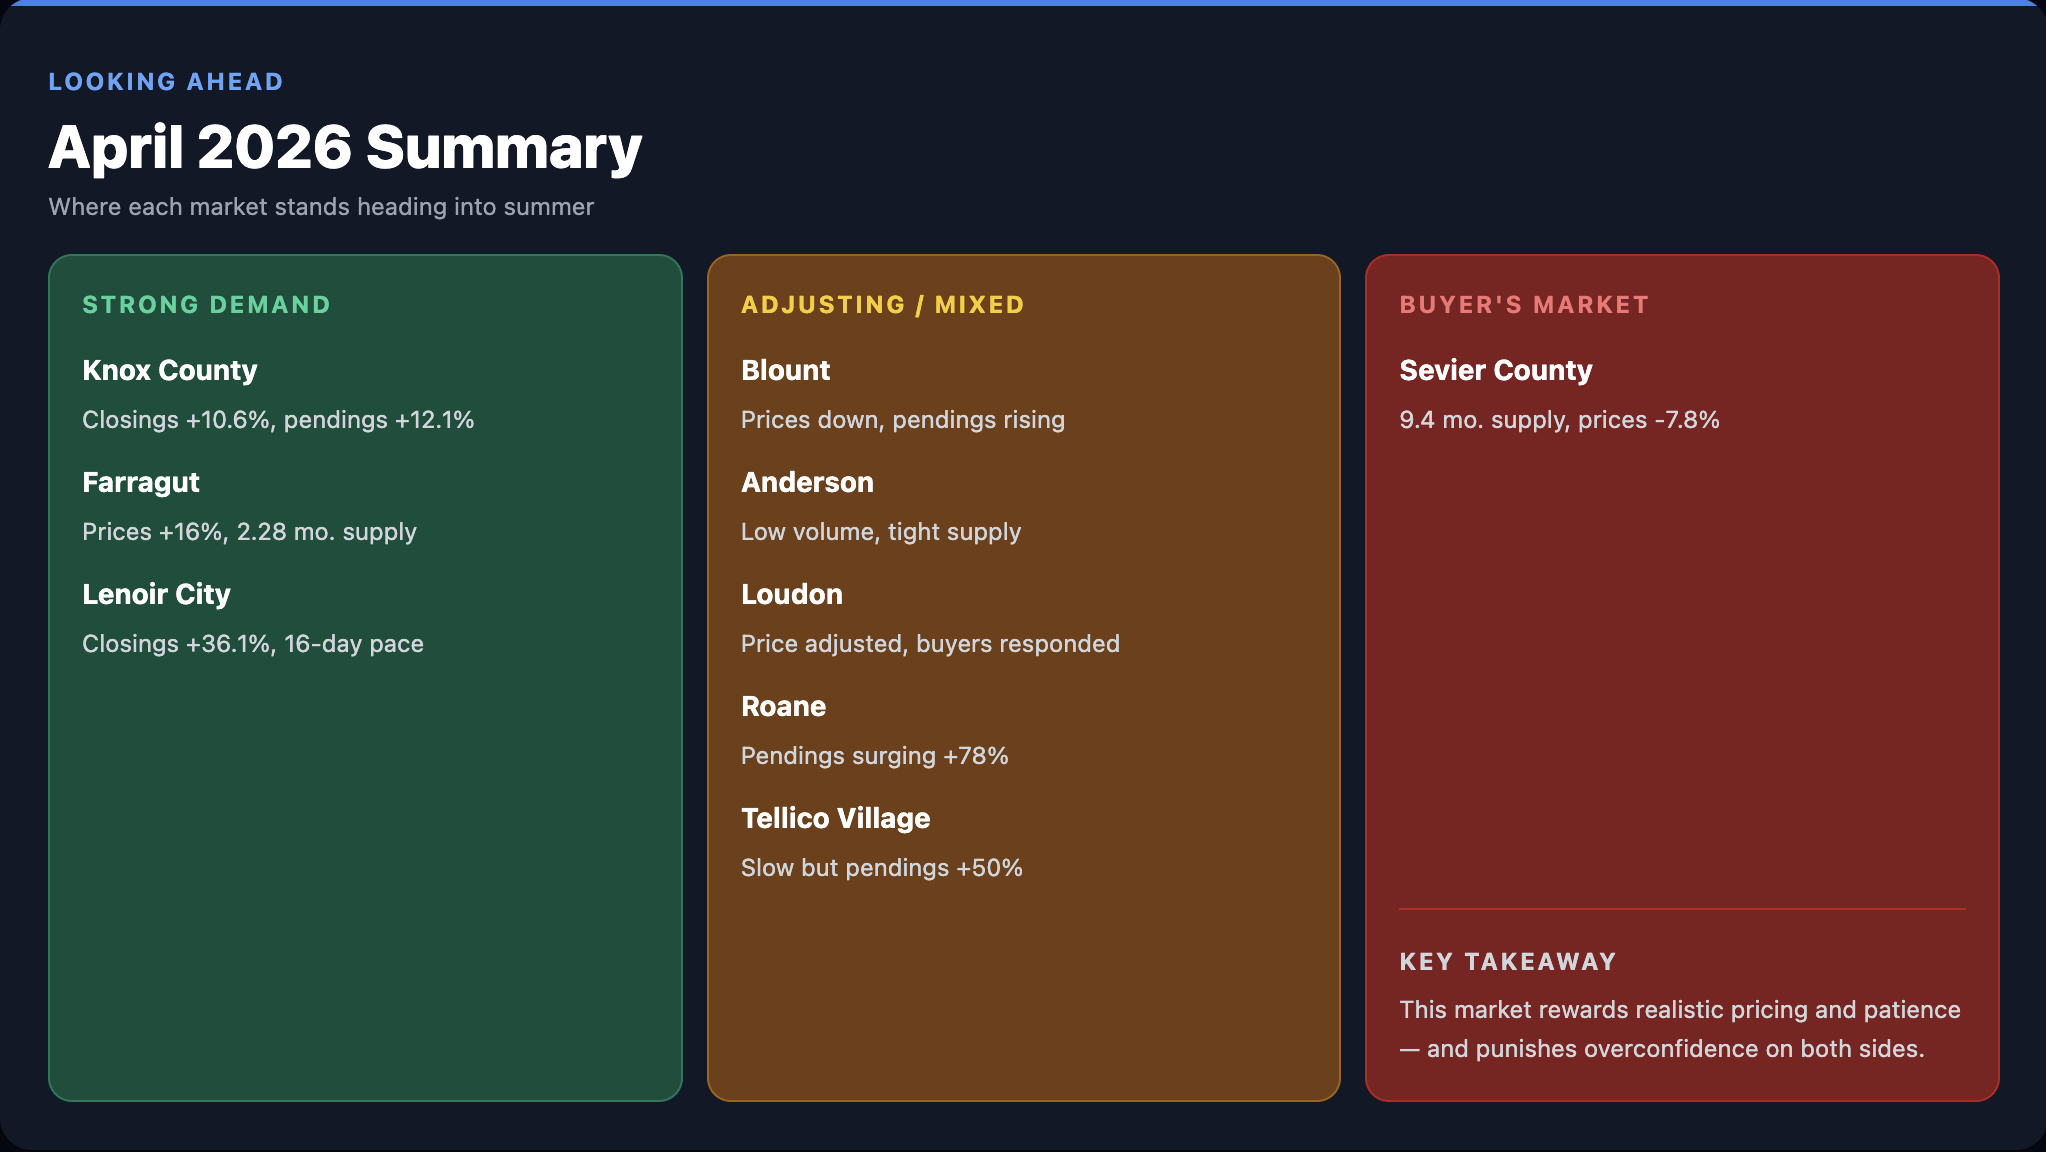
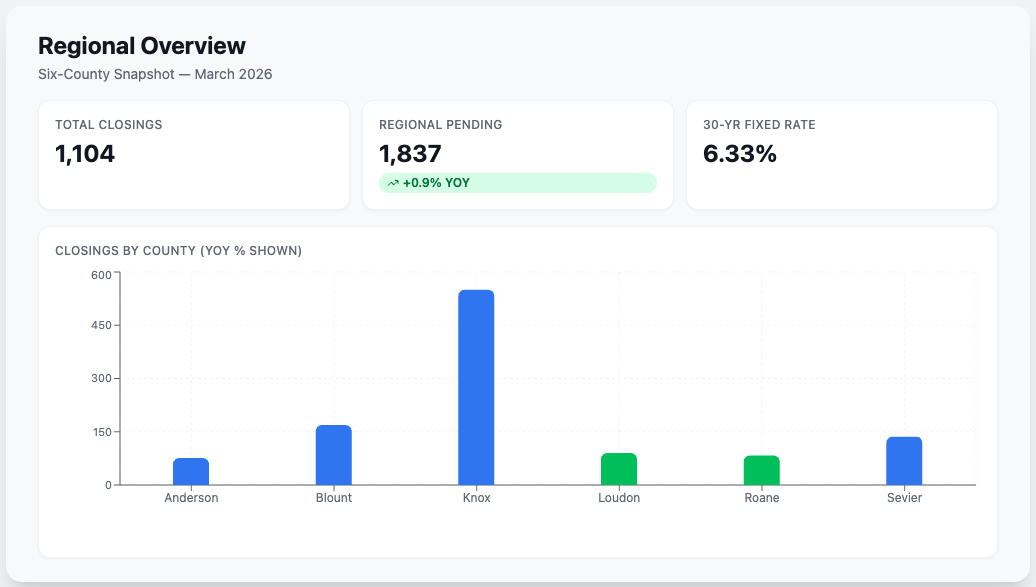
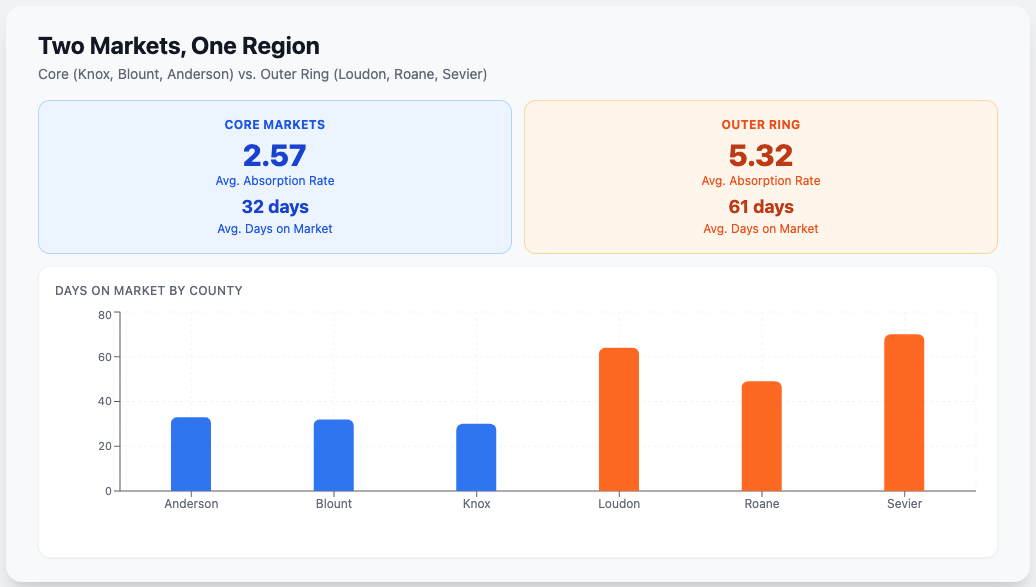
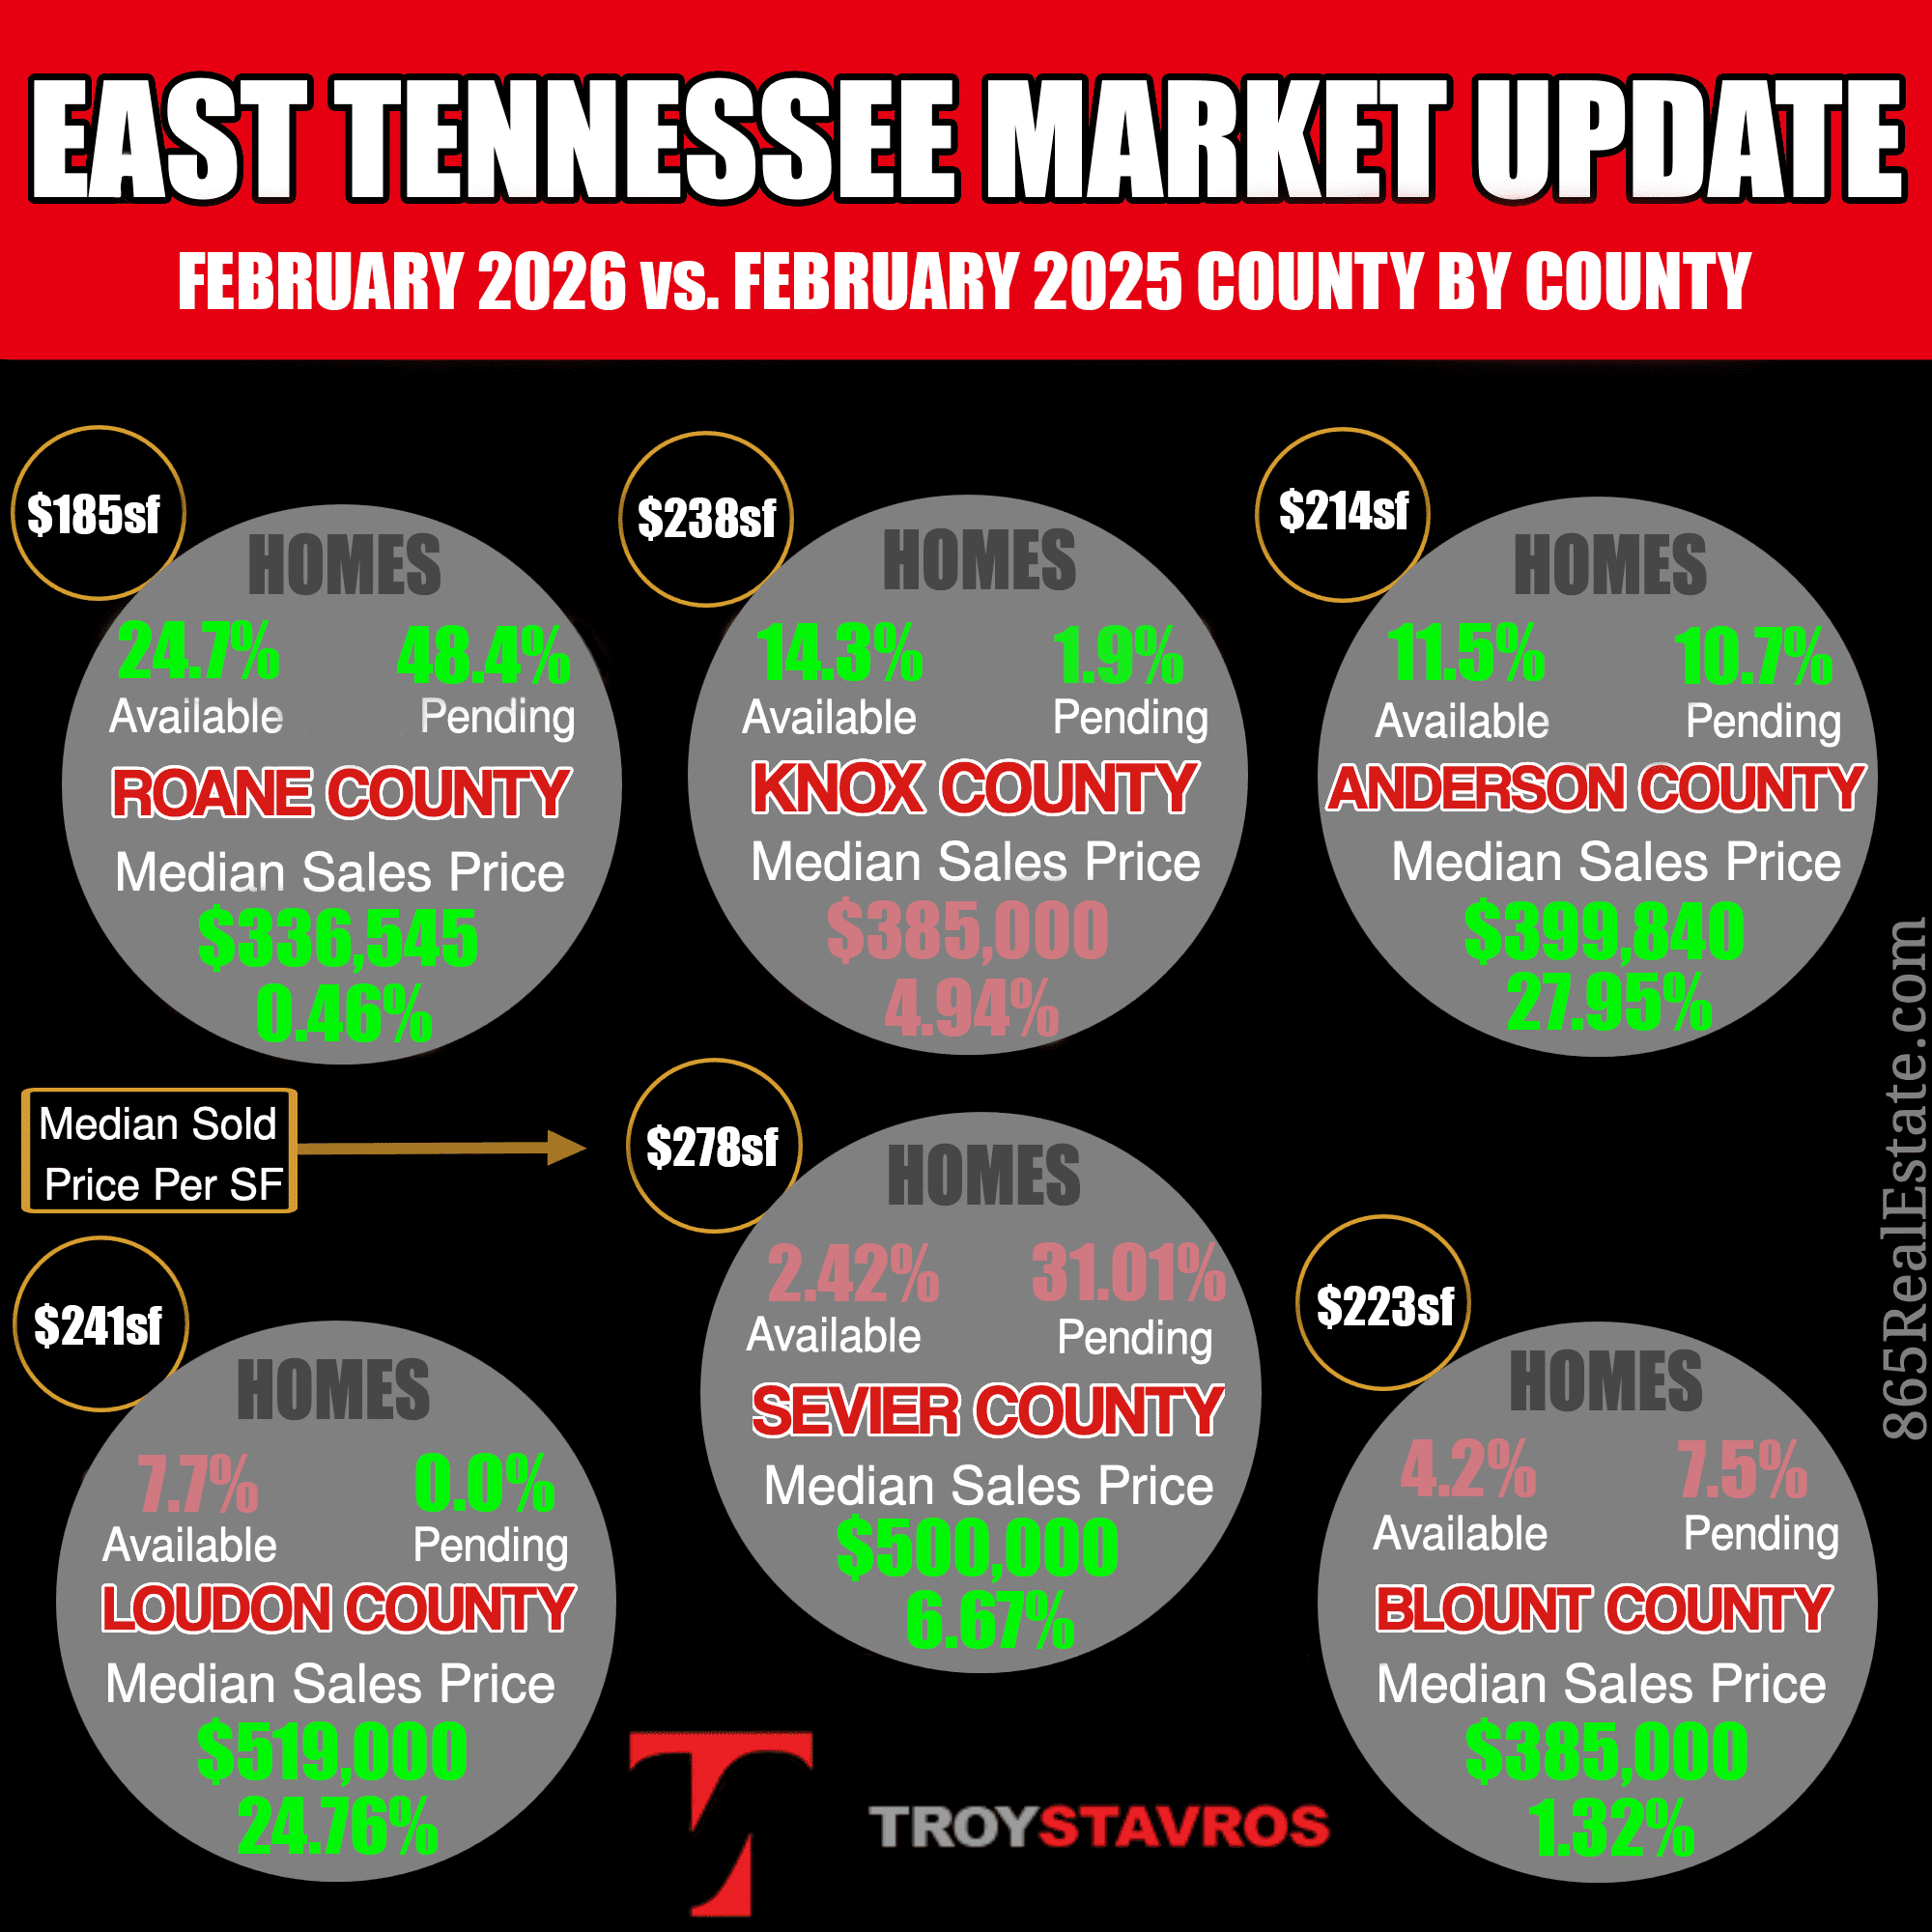
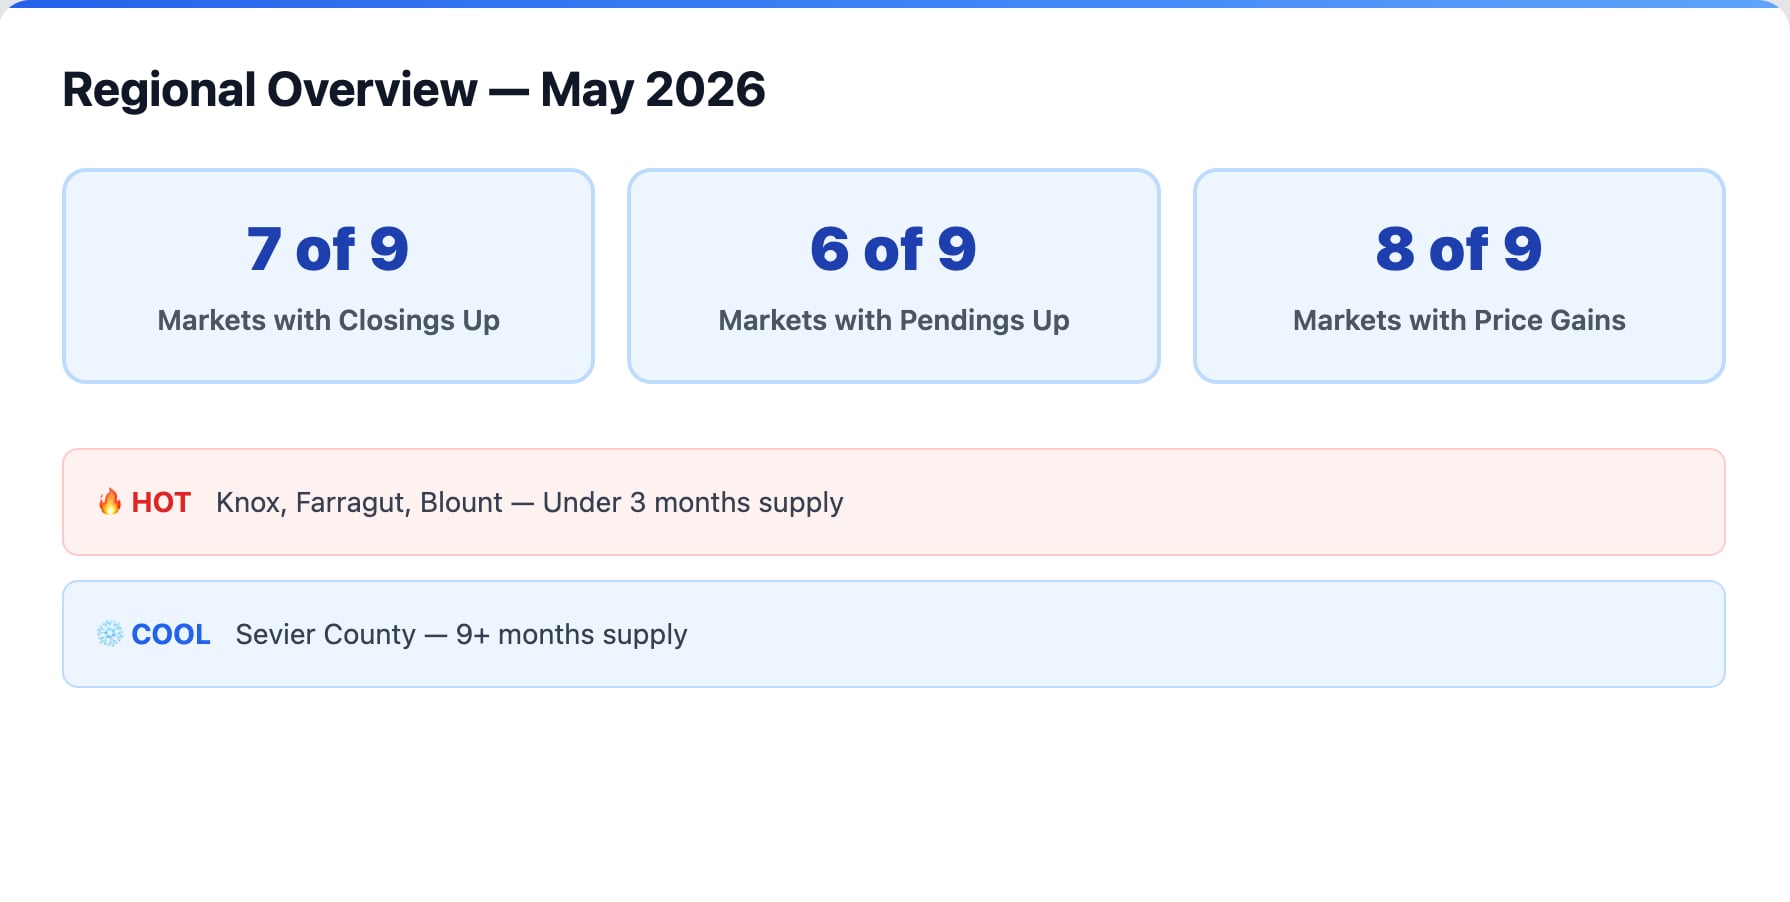
Regional Overview: Strength Across the Board with One Notable Exception
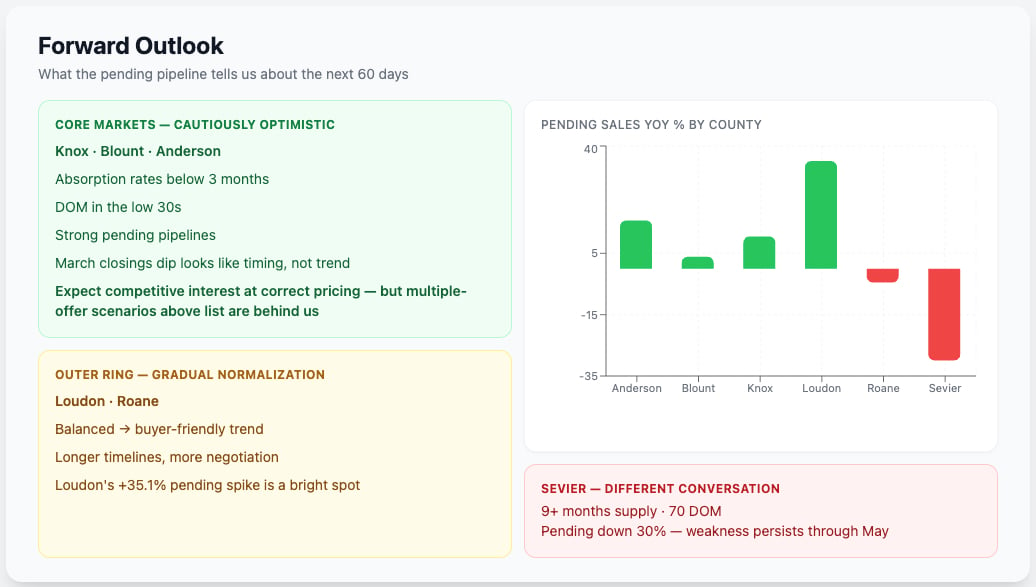
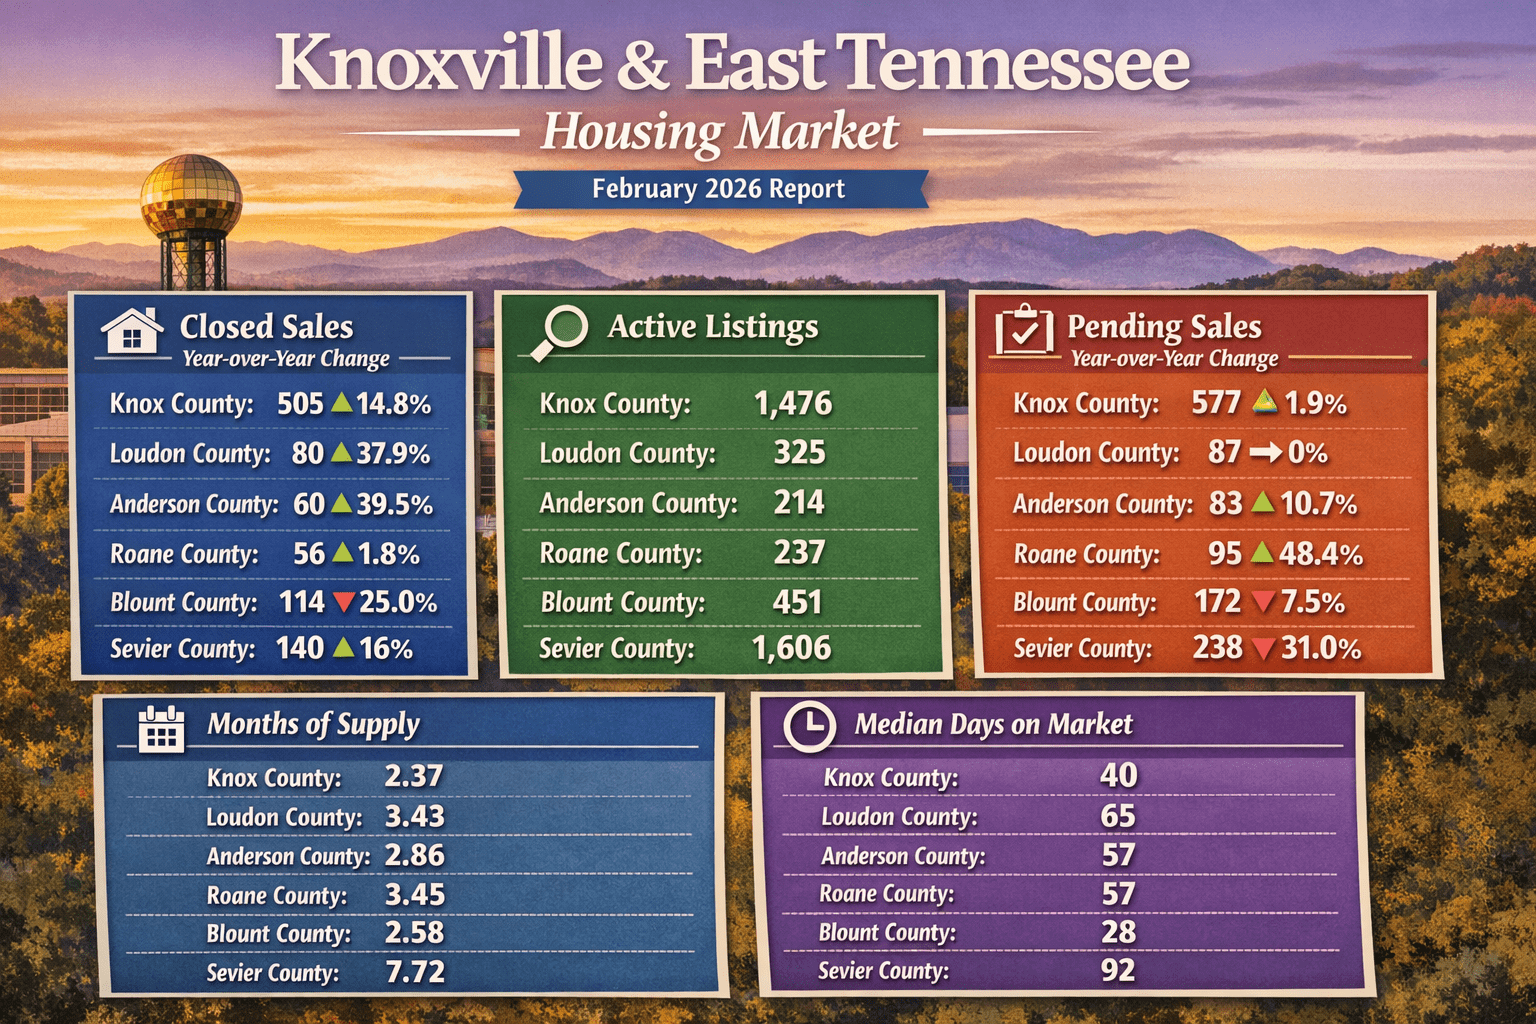
Across the 9 East Tennessee markets tracked in this analysis, the May 2026 data reveals broad-based strength. 7 of 9 markets posted year-over-year increases in closed sales. 6 of 9 saw pending sales climb, a forward-looking indicator that suggests continued momentum into the summer months. And 8 of 9 markets recorded median price gains, confirming that demand continues to outpace supply in nearly every corner of the region.
The absorption rate — the number of months it would take to sell all current inventory at the present pace of sales — ranges from a tight 2.66 months in Farragut to a sprawling 9.29 months in Sevier County. That range tells the story of a region where hyperlocal conditions matter enormously, and where blanket statements about the “housing market” miss the nuance that buyers, sellers, and agents need to make informed decisions.
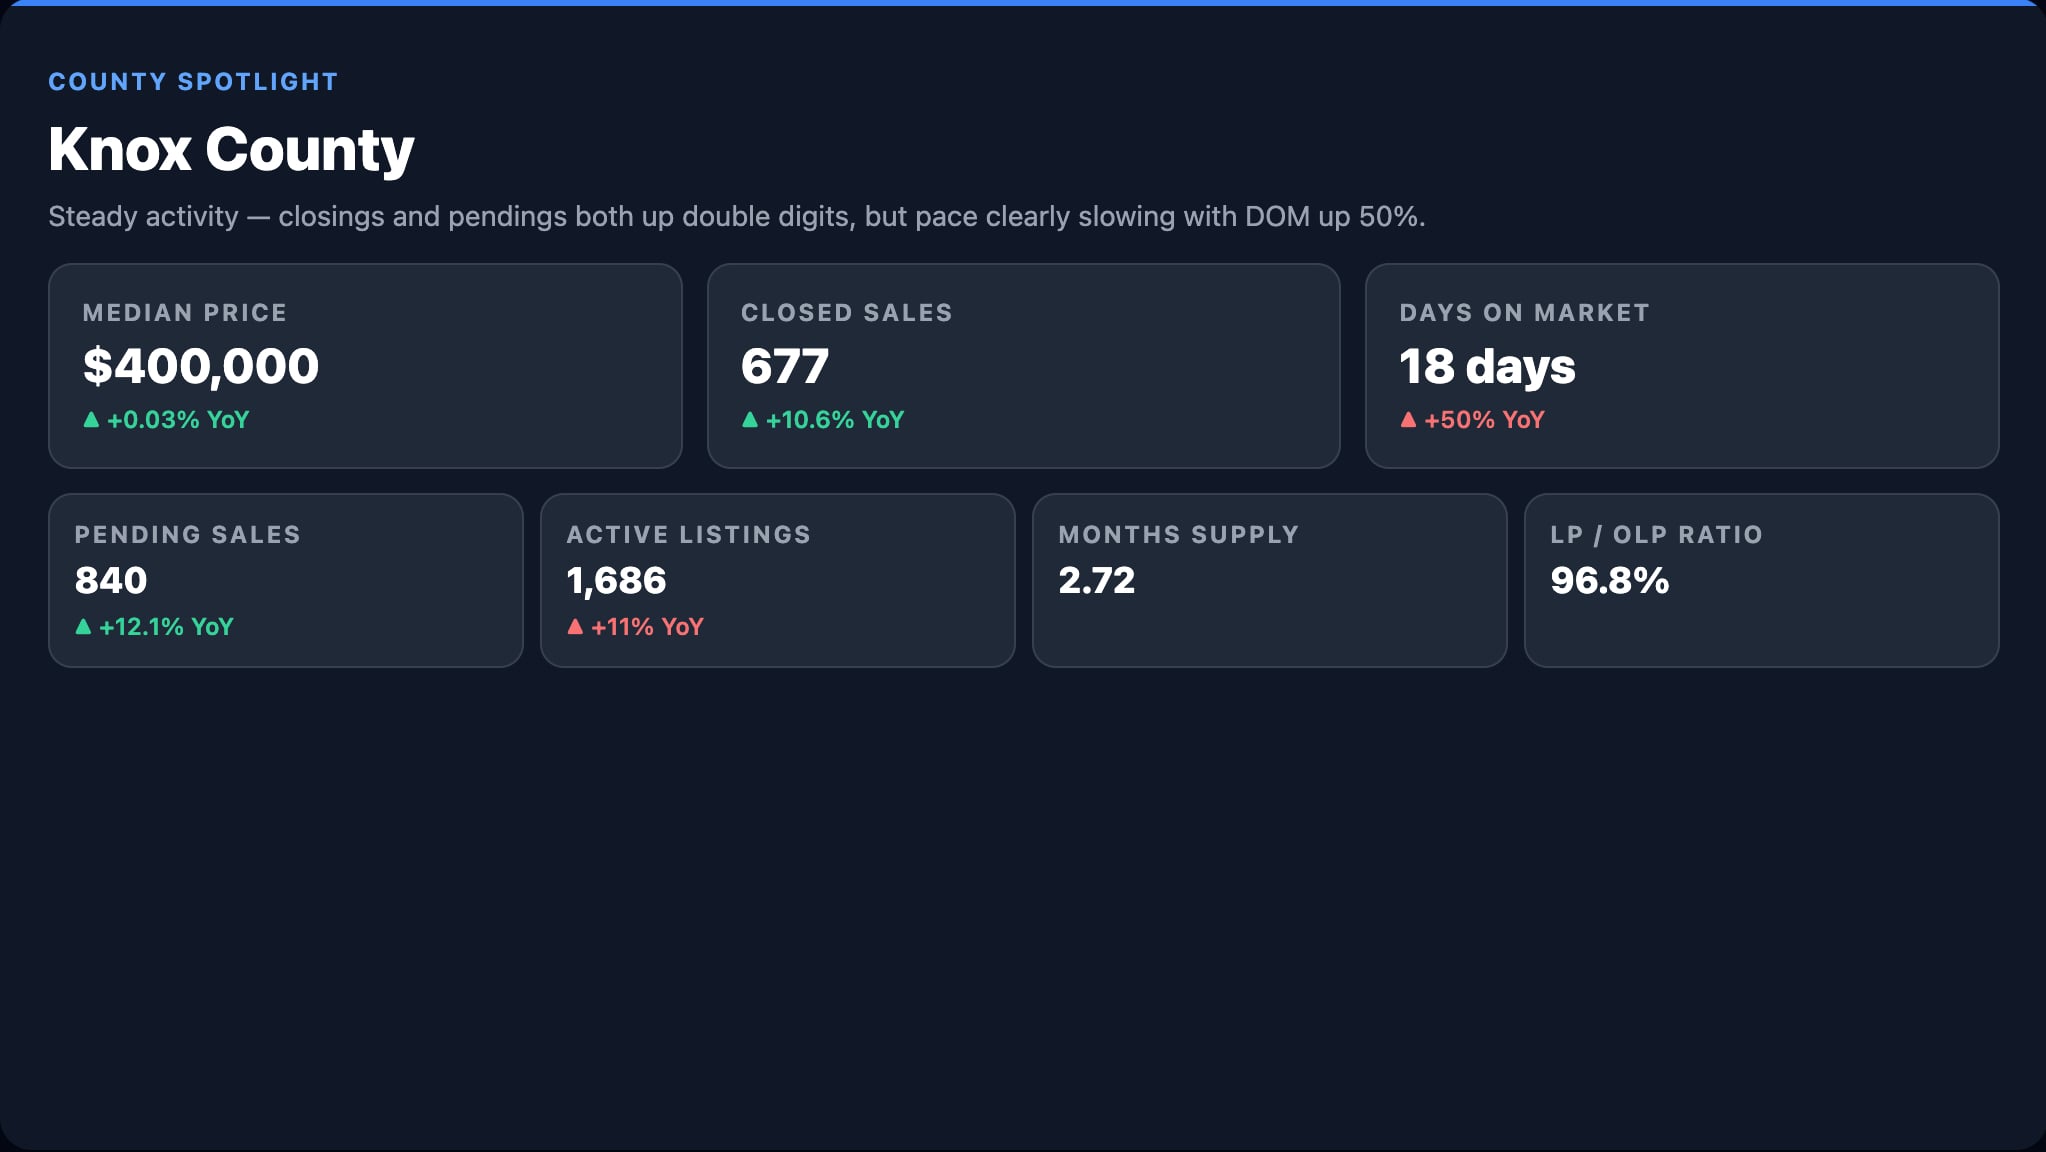
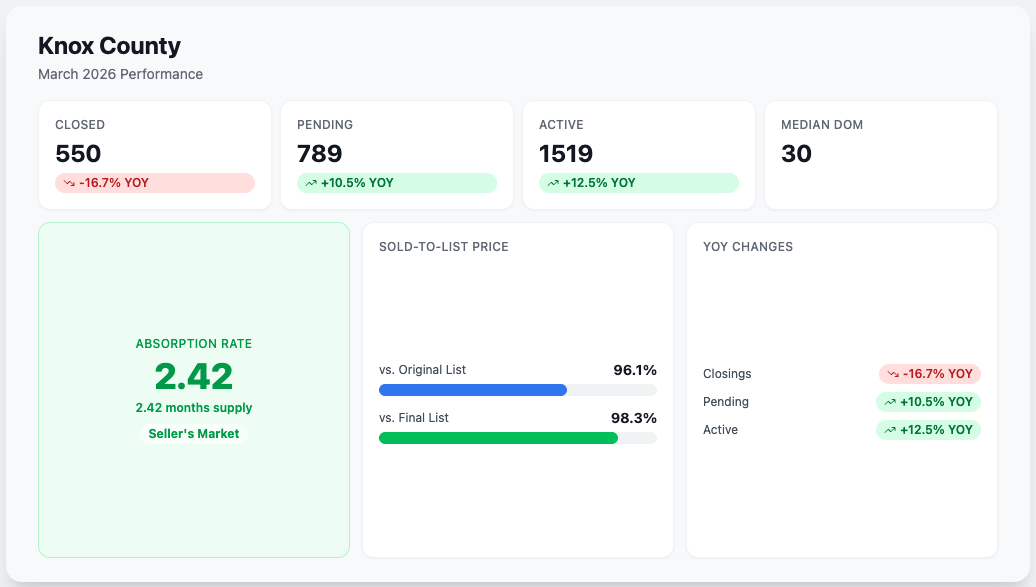
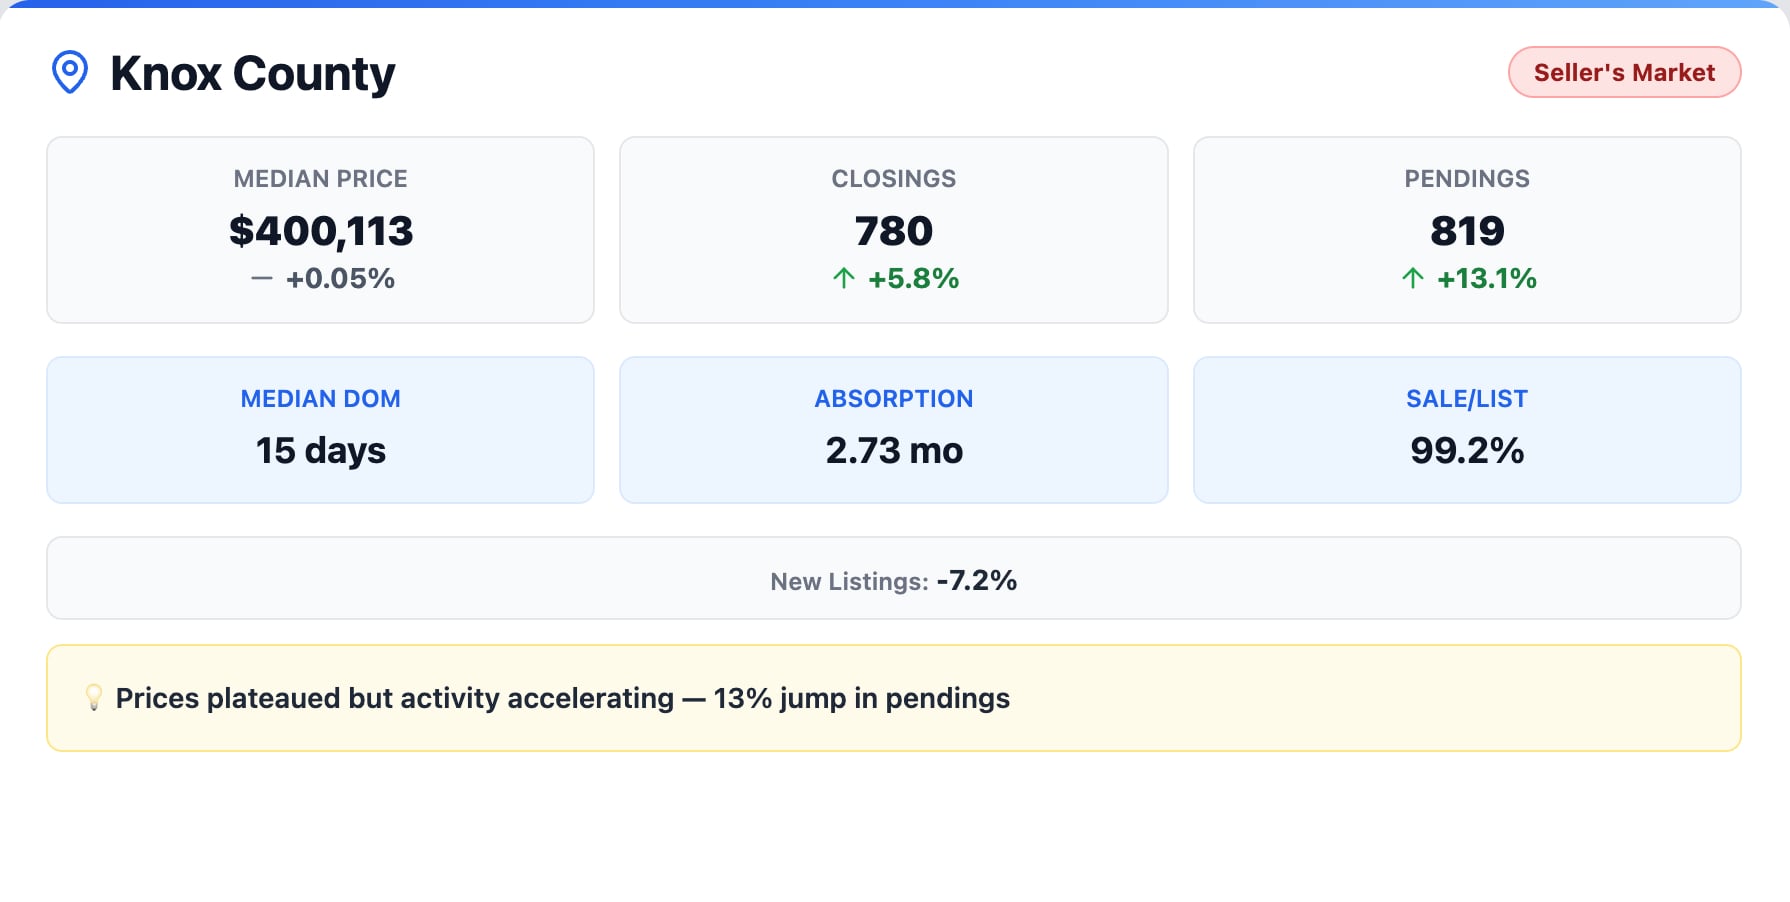
Knox County: The Engine Keeps Running
Knox County remains the anchor of the East Tennessee housing market, and the May 2026 numbers show an interesting dynamic. The median sale price came in at $400,113, essentially flat year over year with just a 0.05% increase. Prices have plateaued — but activity is accelerating underneath the surface.
Closed sales reached 780 units, up 5.8% from the same month last year. Pending sales jumped to 819, a 13.1% increase that signals strong momentum heading into summer. The median days on market held at just 15, and the absorption rate sits at 2.73 months — firmly in seller’s market territory. The sale-to-list price ratio of 99.2% indicates that homes priced correctly are selling at or very near asking price, while new listings declined 7.2% year over year, reinforcing the lock-in dynamic.
The takeaway for Knox County is straightforward. Prices may have hit a near-term ceiling as affordability constraints bite, but buyer demand remains robust. Sellers who price accurately will move their homes quickly. Those who overshoot will sit.
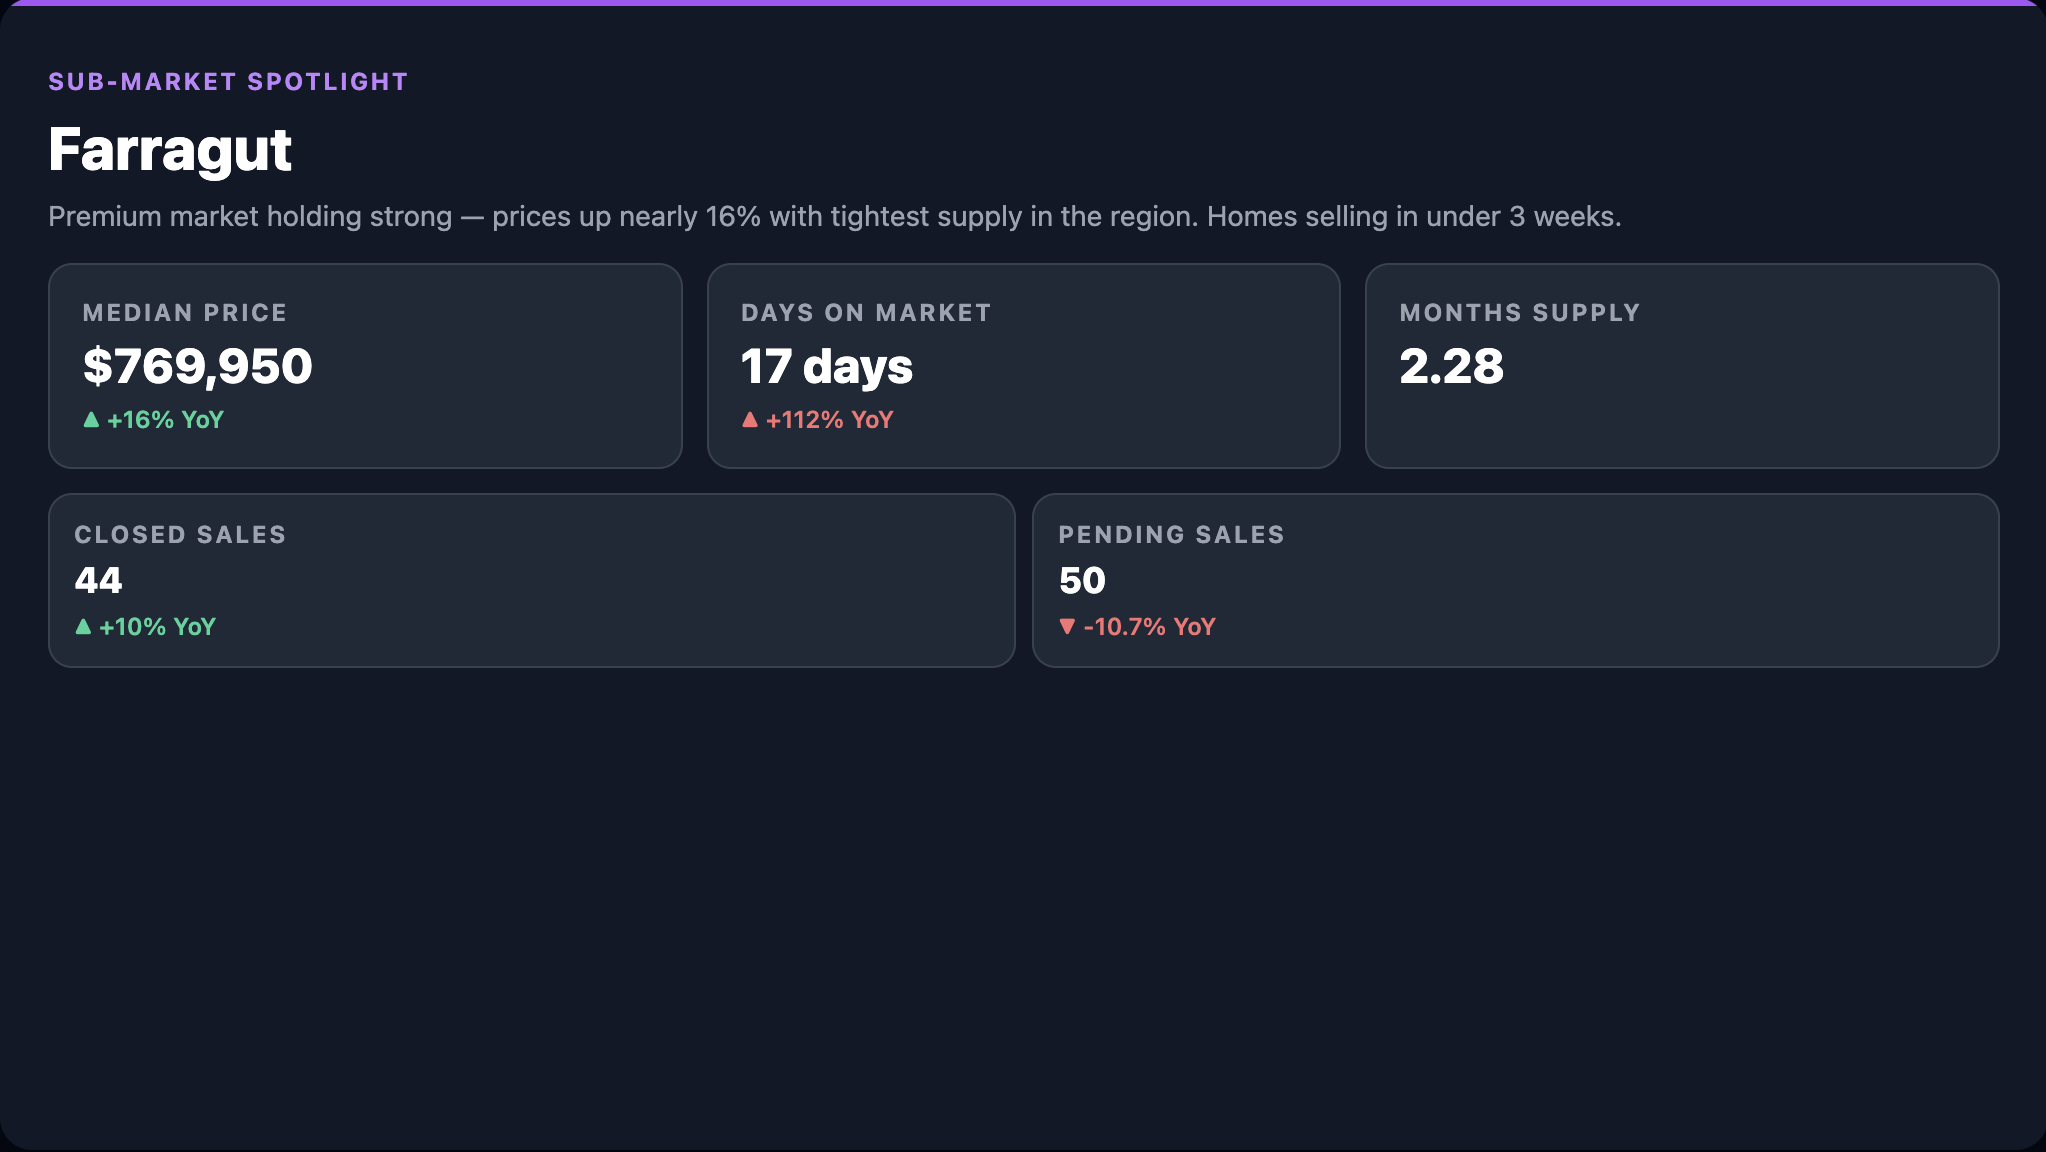
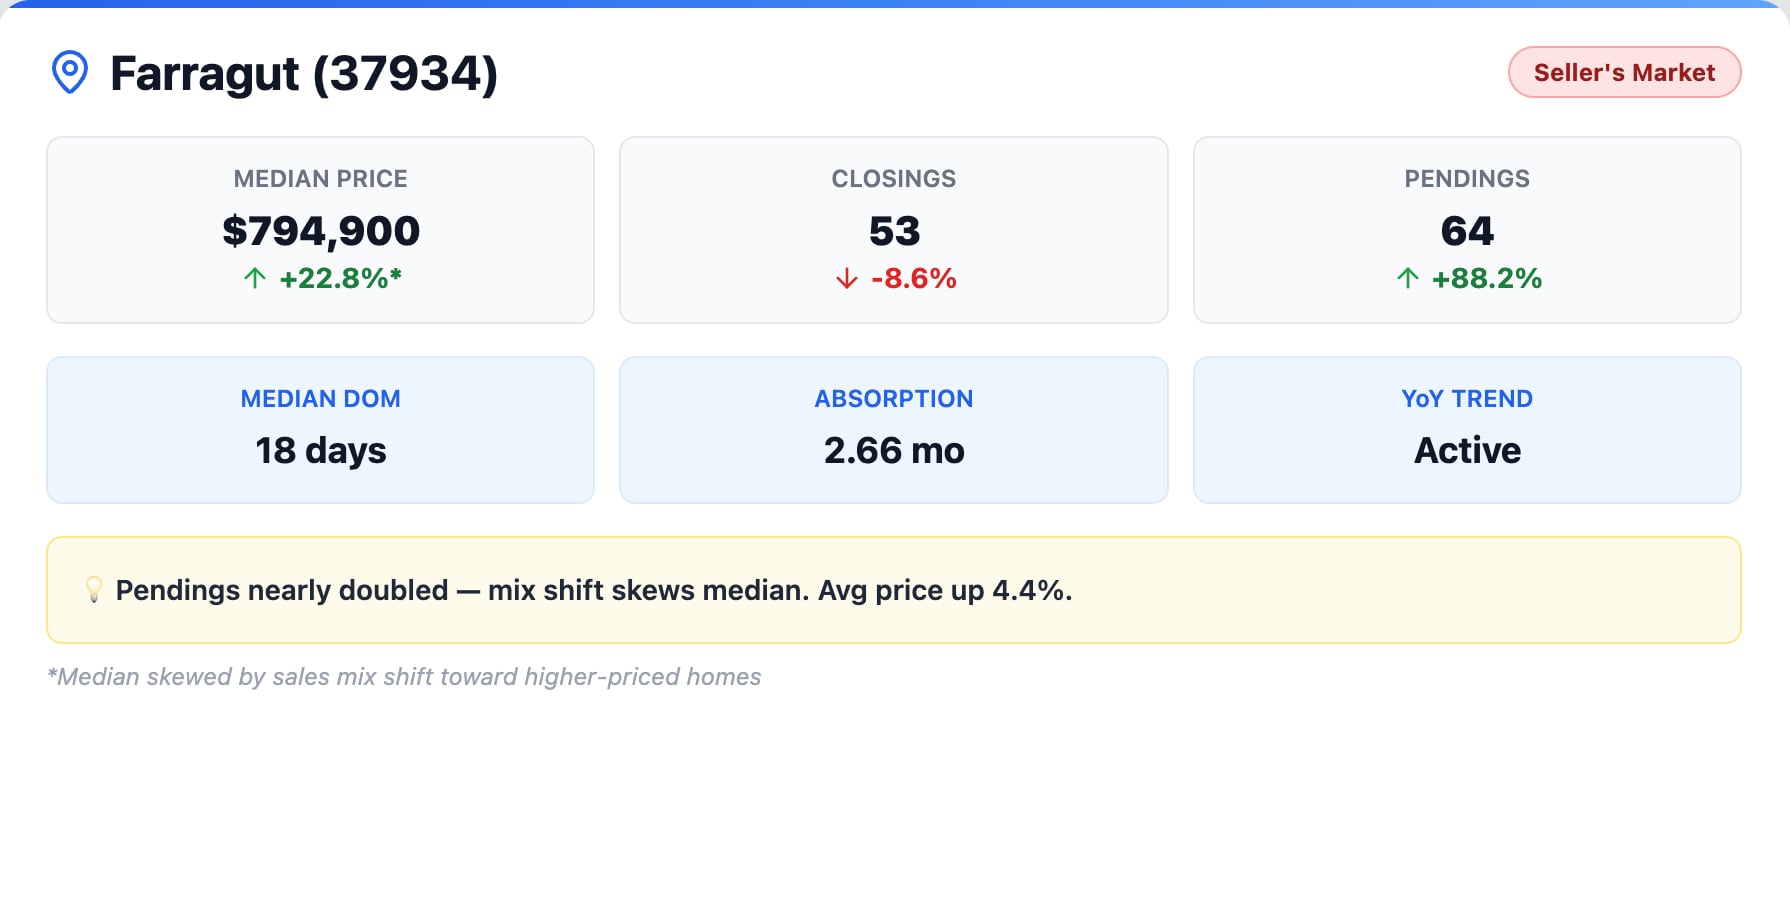
Farragut (37934): Pendings Nearly Double
Farragut’s May data demands careful interpretation. The median sale price of $794,900 represents a 22.8% year-over-year increase, but that figure is heavily skewed by a sales mix shift toward higher-priced homes rather than a true across-the-board appreciation surge. The average sale price, which smooths out those distortions, rose a more measured 4.4%.
The real story in Farragut is pending sales, which surged 88.2% year over year to 64 contracts. That is the kind of number that signals a market in high demand. Closed sales dipped modestly by 8.6% to 53 units, but with the pendings pipeline nearly doubling, closings should follow in the months ahead. At just 18 median days on market and a 2.66-month absorption rate, Farragut remains one of the tightest seller’s markets in the entire region.
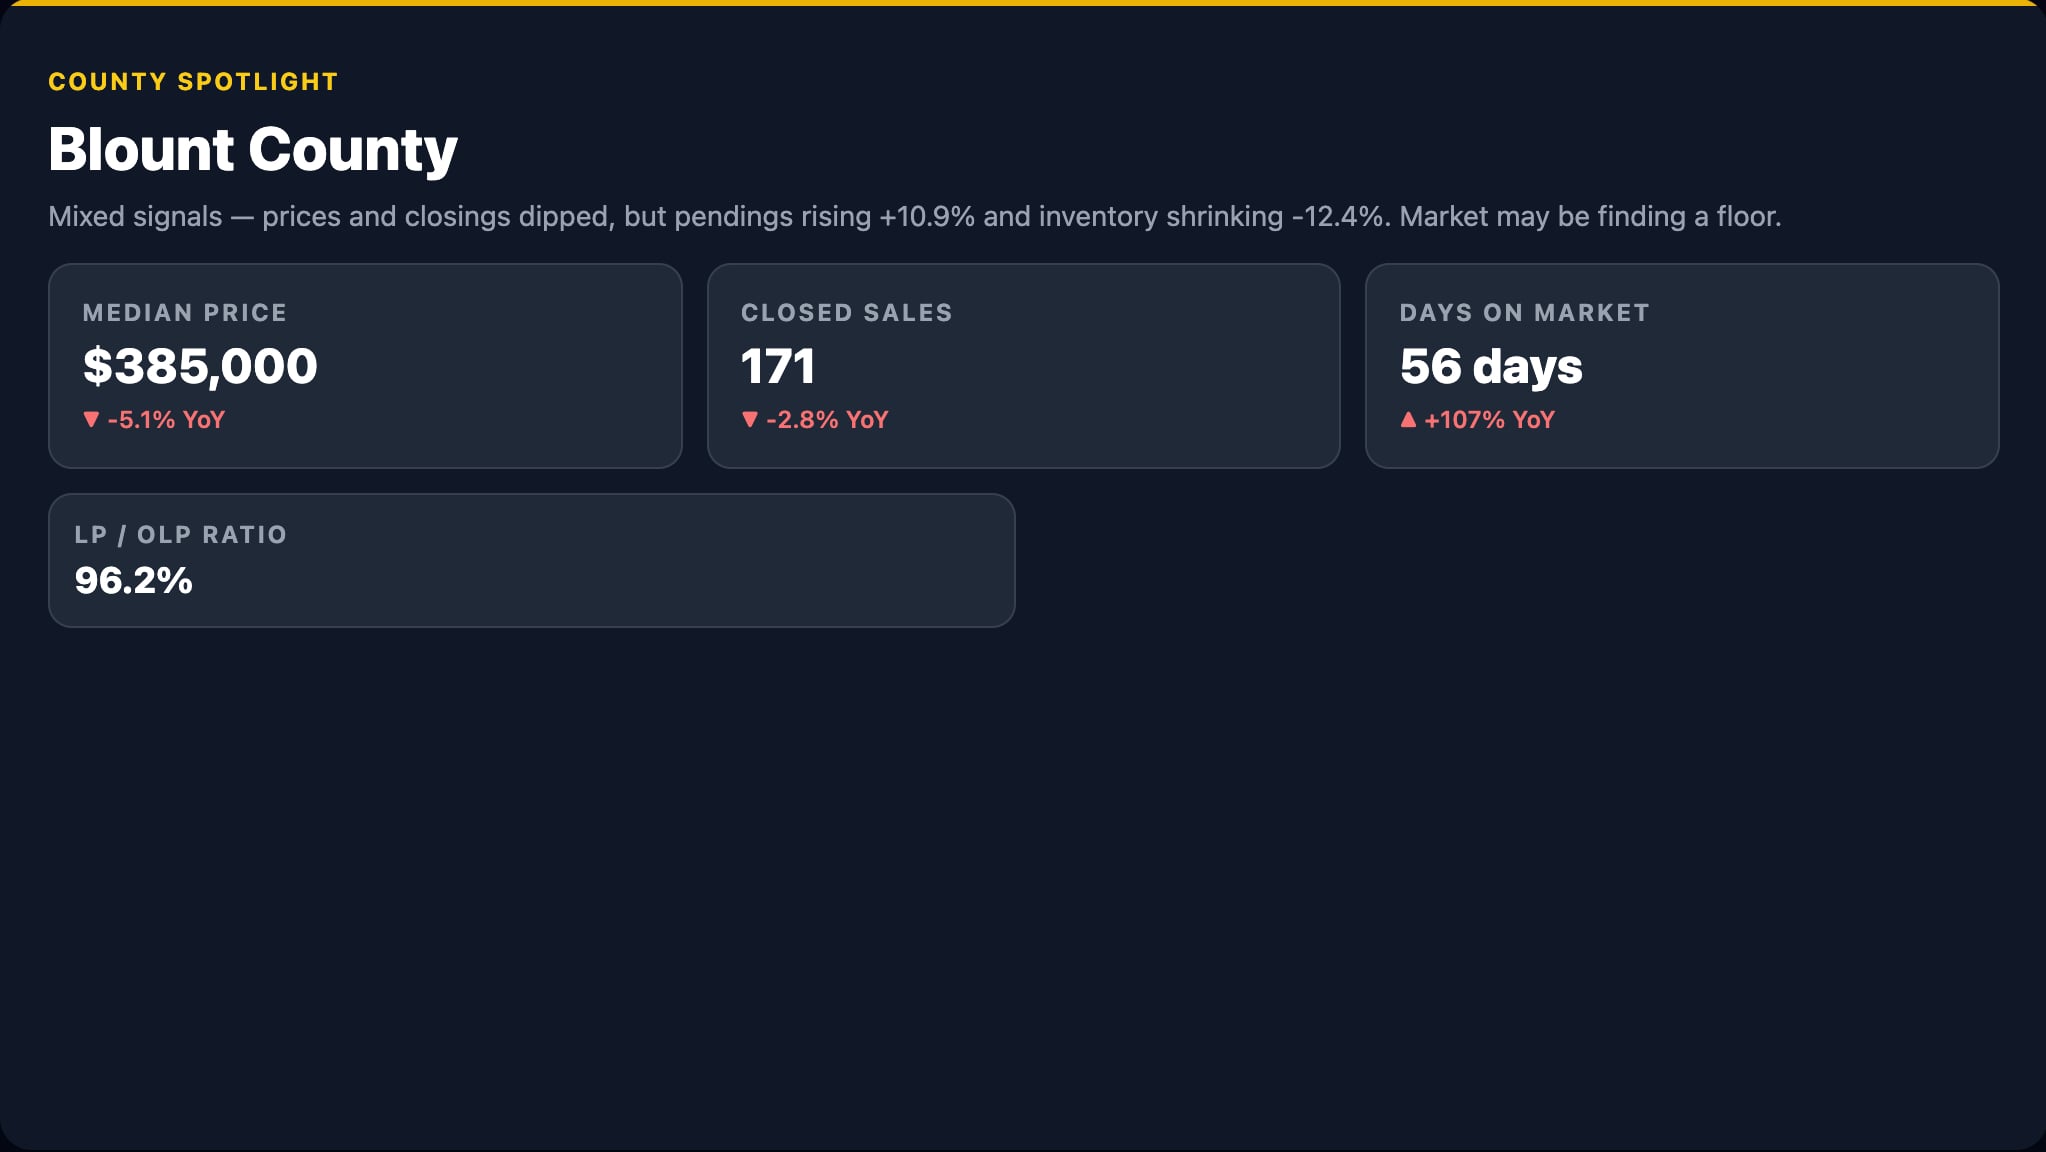
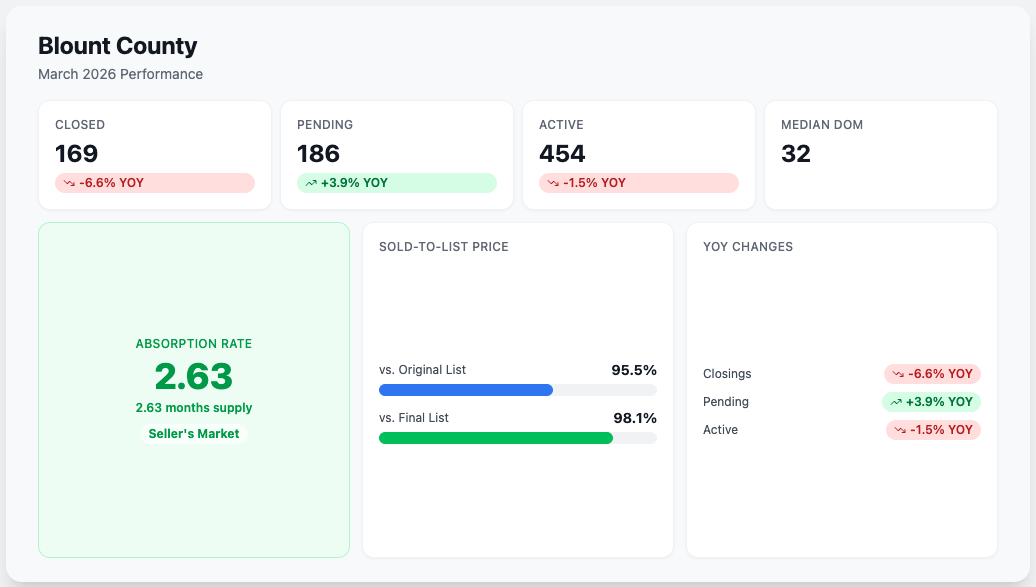
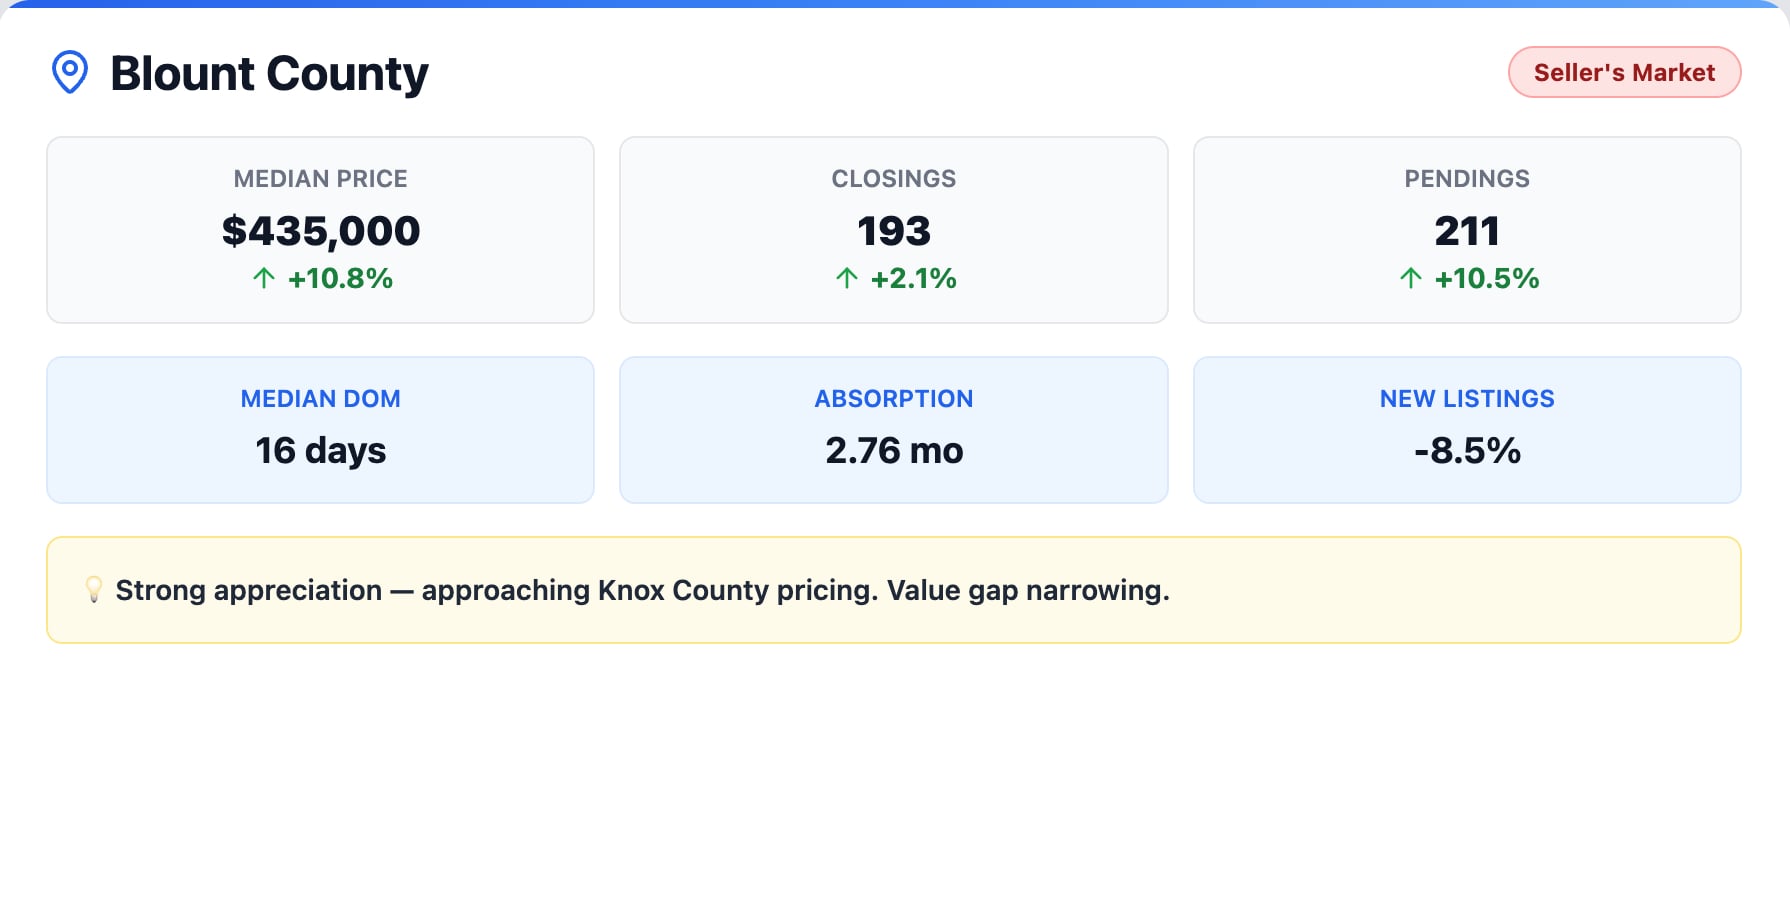
Blount County: Closing the Gap with Knox
Blount County has been quietly emerging as one of the region’s strongest performers, and the May 2026 numbers reinforce that trajectory. The median sale price reached $435,000, a 10.8% year-over-year gain that is rapidly narrowing the pricing gap with neighboring Knox County.
Closings rose 2.1% to 193 units, while pendings climbed 10.5% to 211 — a healthy forward indicator. Homes are selling in a median of 16 days with an absorption rate of 2.76 months, both consistent with a seller’s market. New listings declined 8.5%, continuing the supply constraint that has characterized the market throughout 2025 and into 2026.
For buyers who have been priced out of Knox County or Farragut, Blount County has historically represented a value alternative. That value gap is shrinking, however, and buyers looking to capitalize on the remaining price differential would be wise to act sooner rather than later.
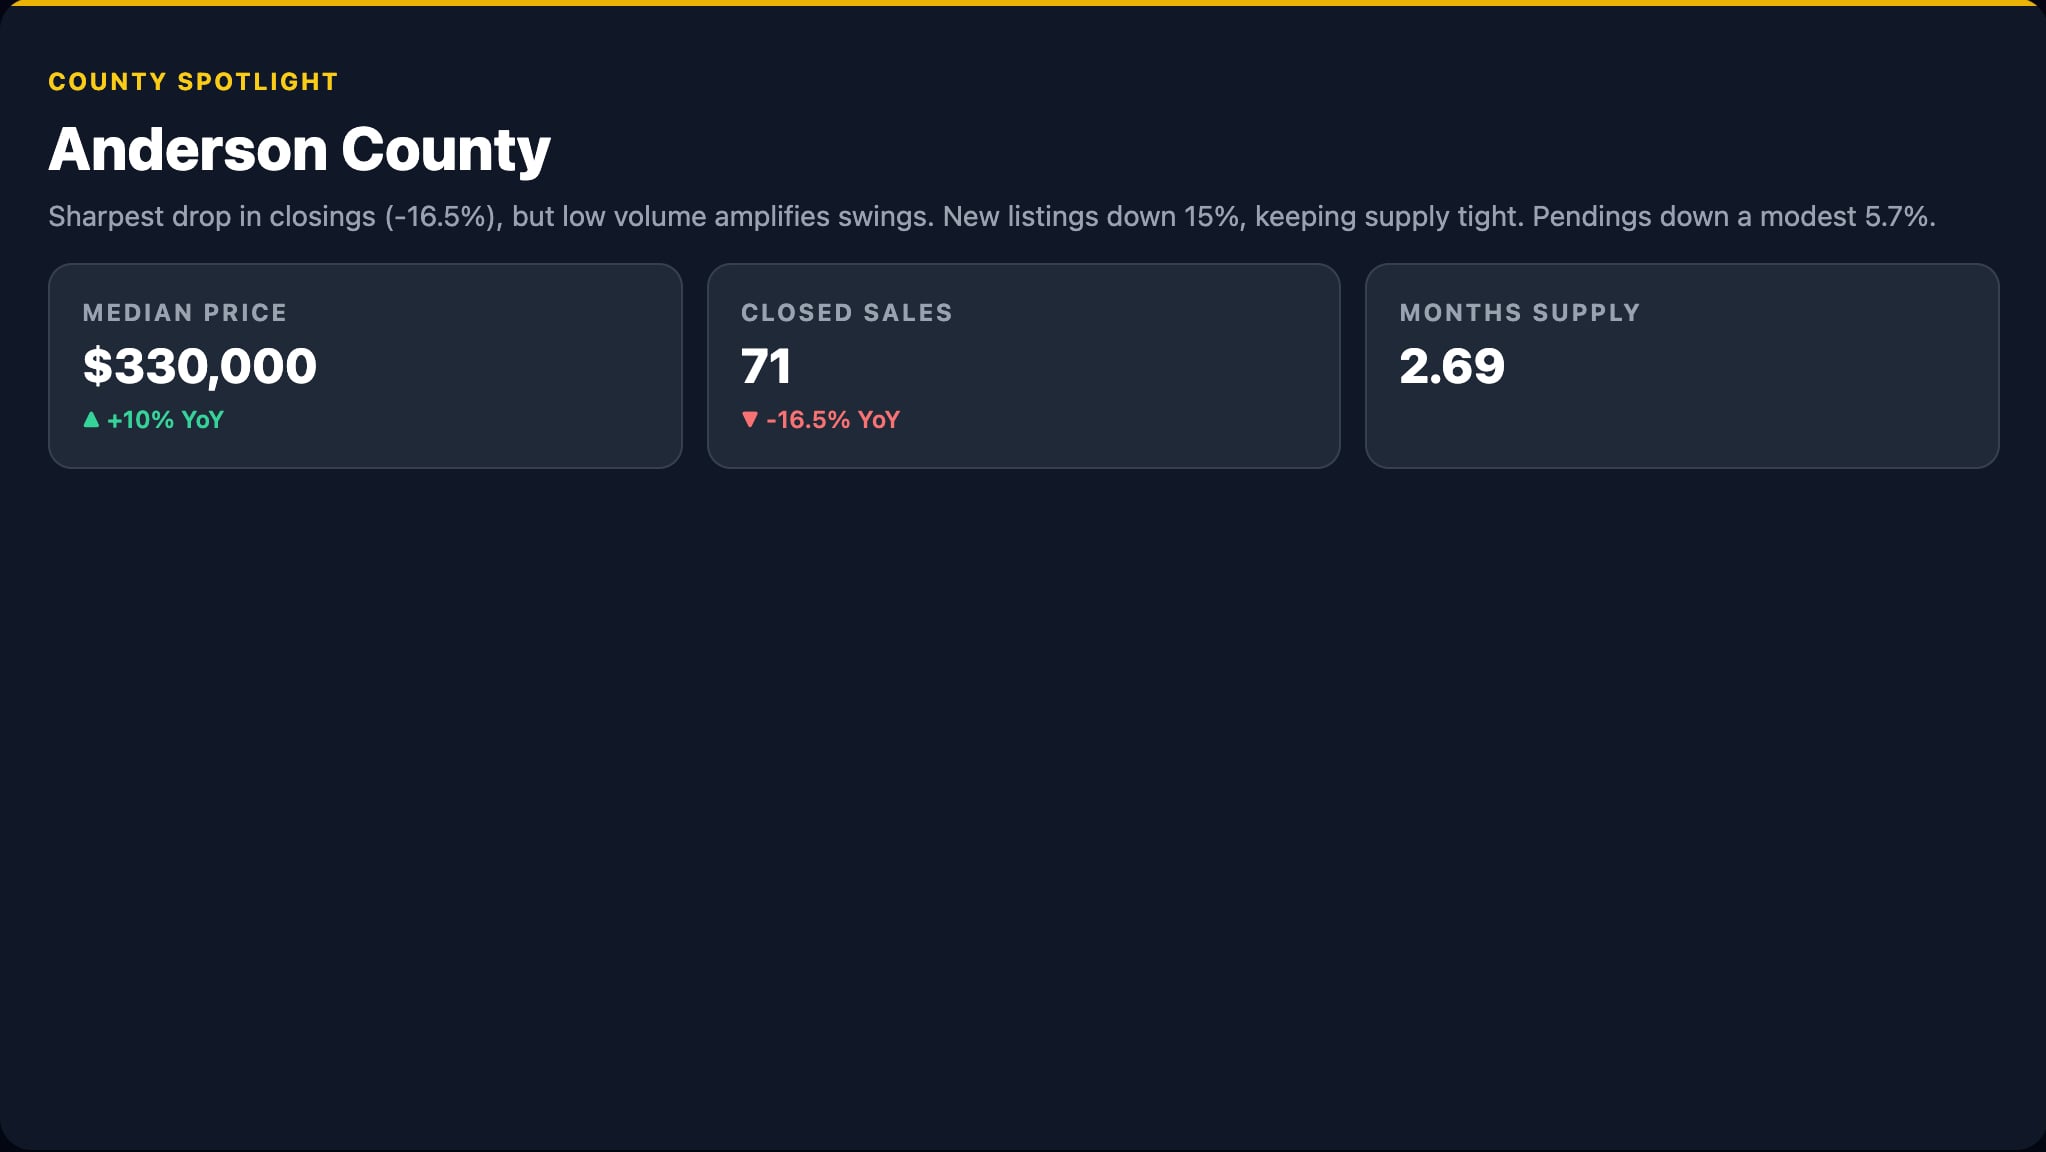
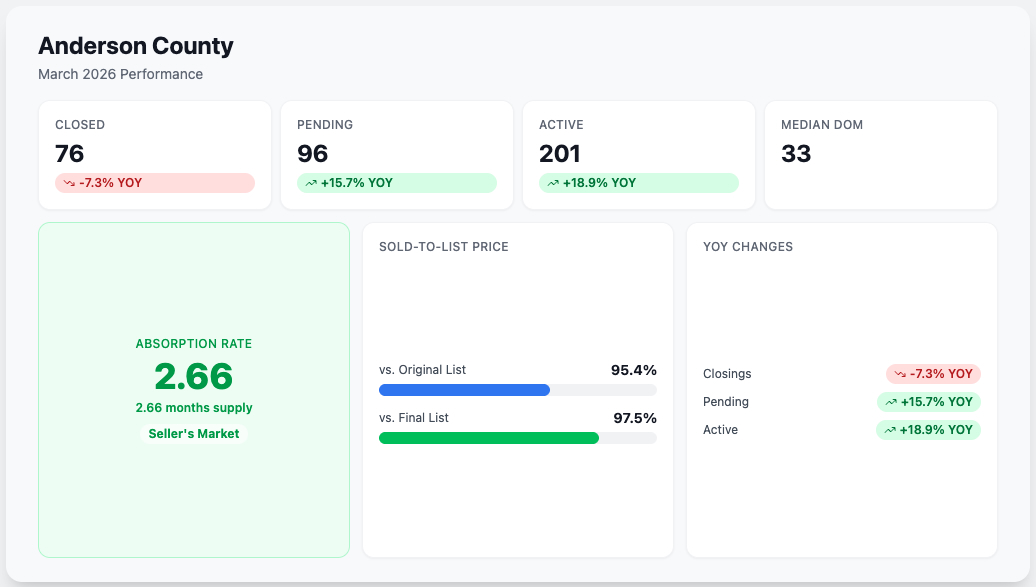
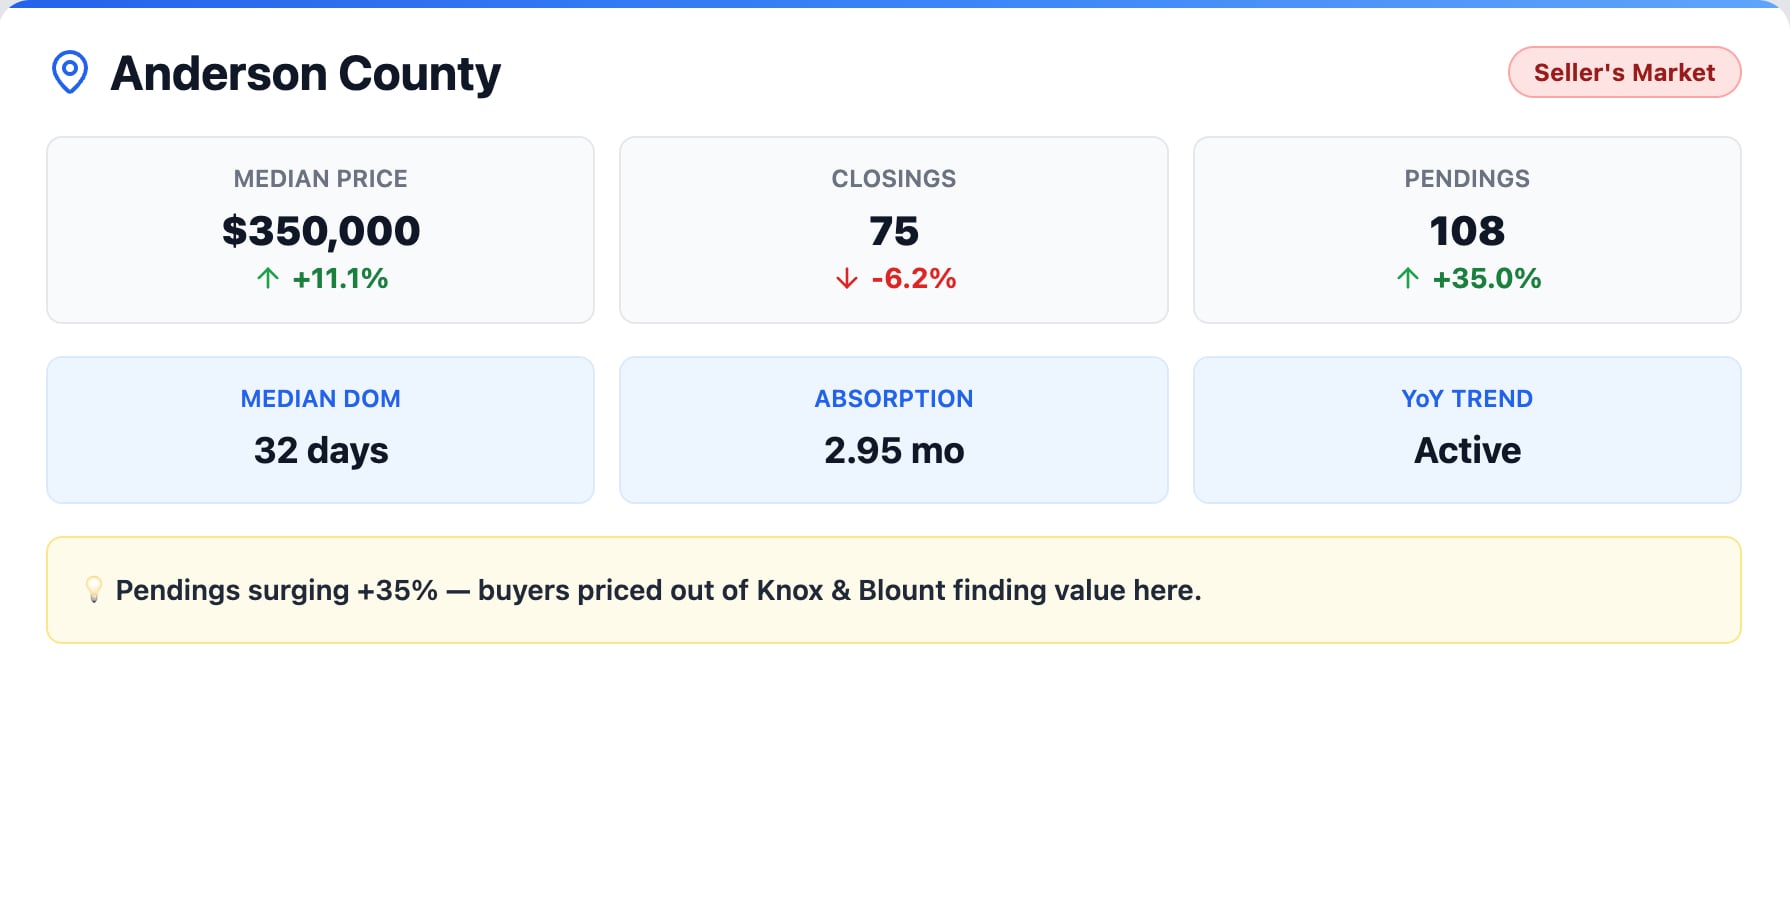
Anderson County: The Spillover Beneficiary
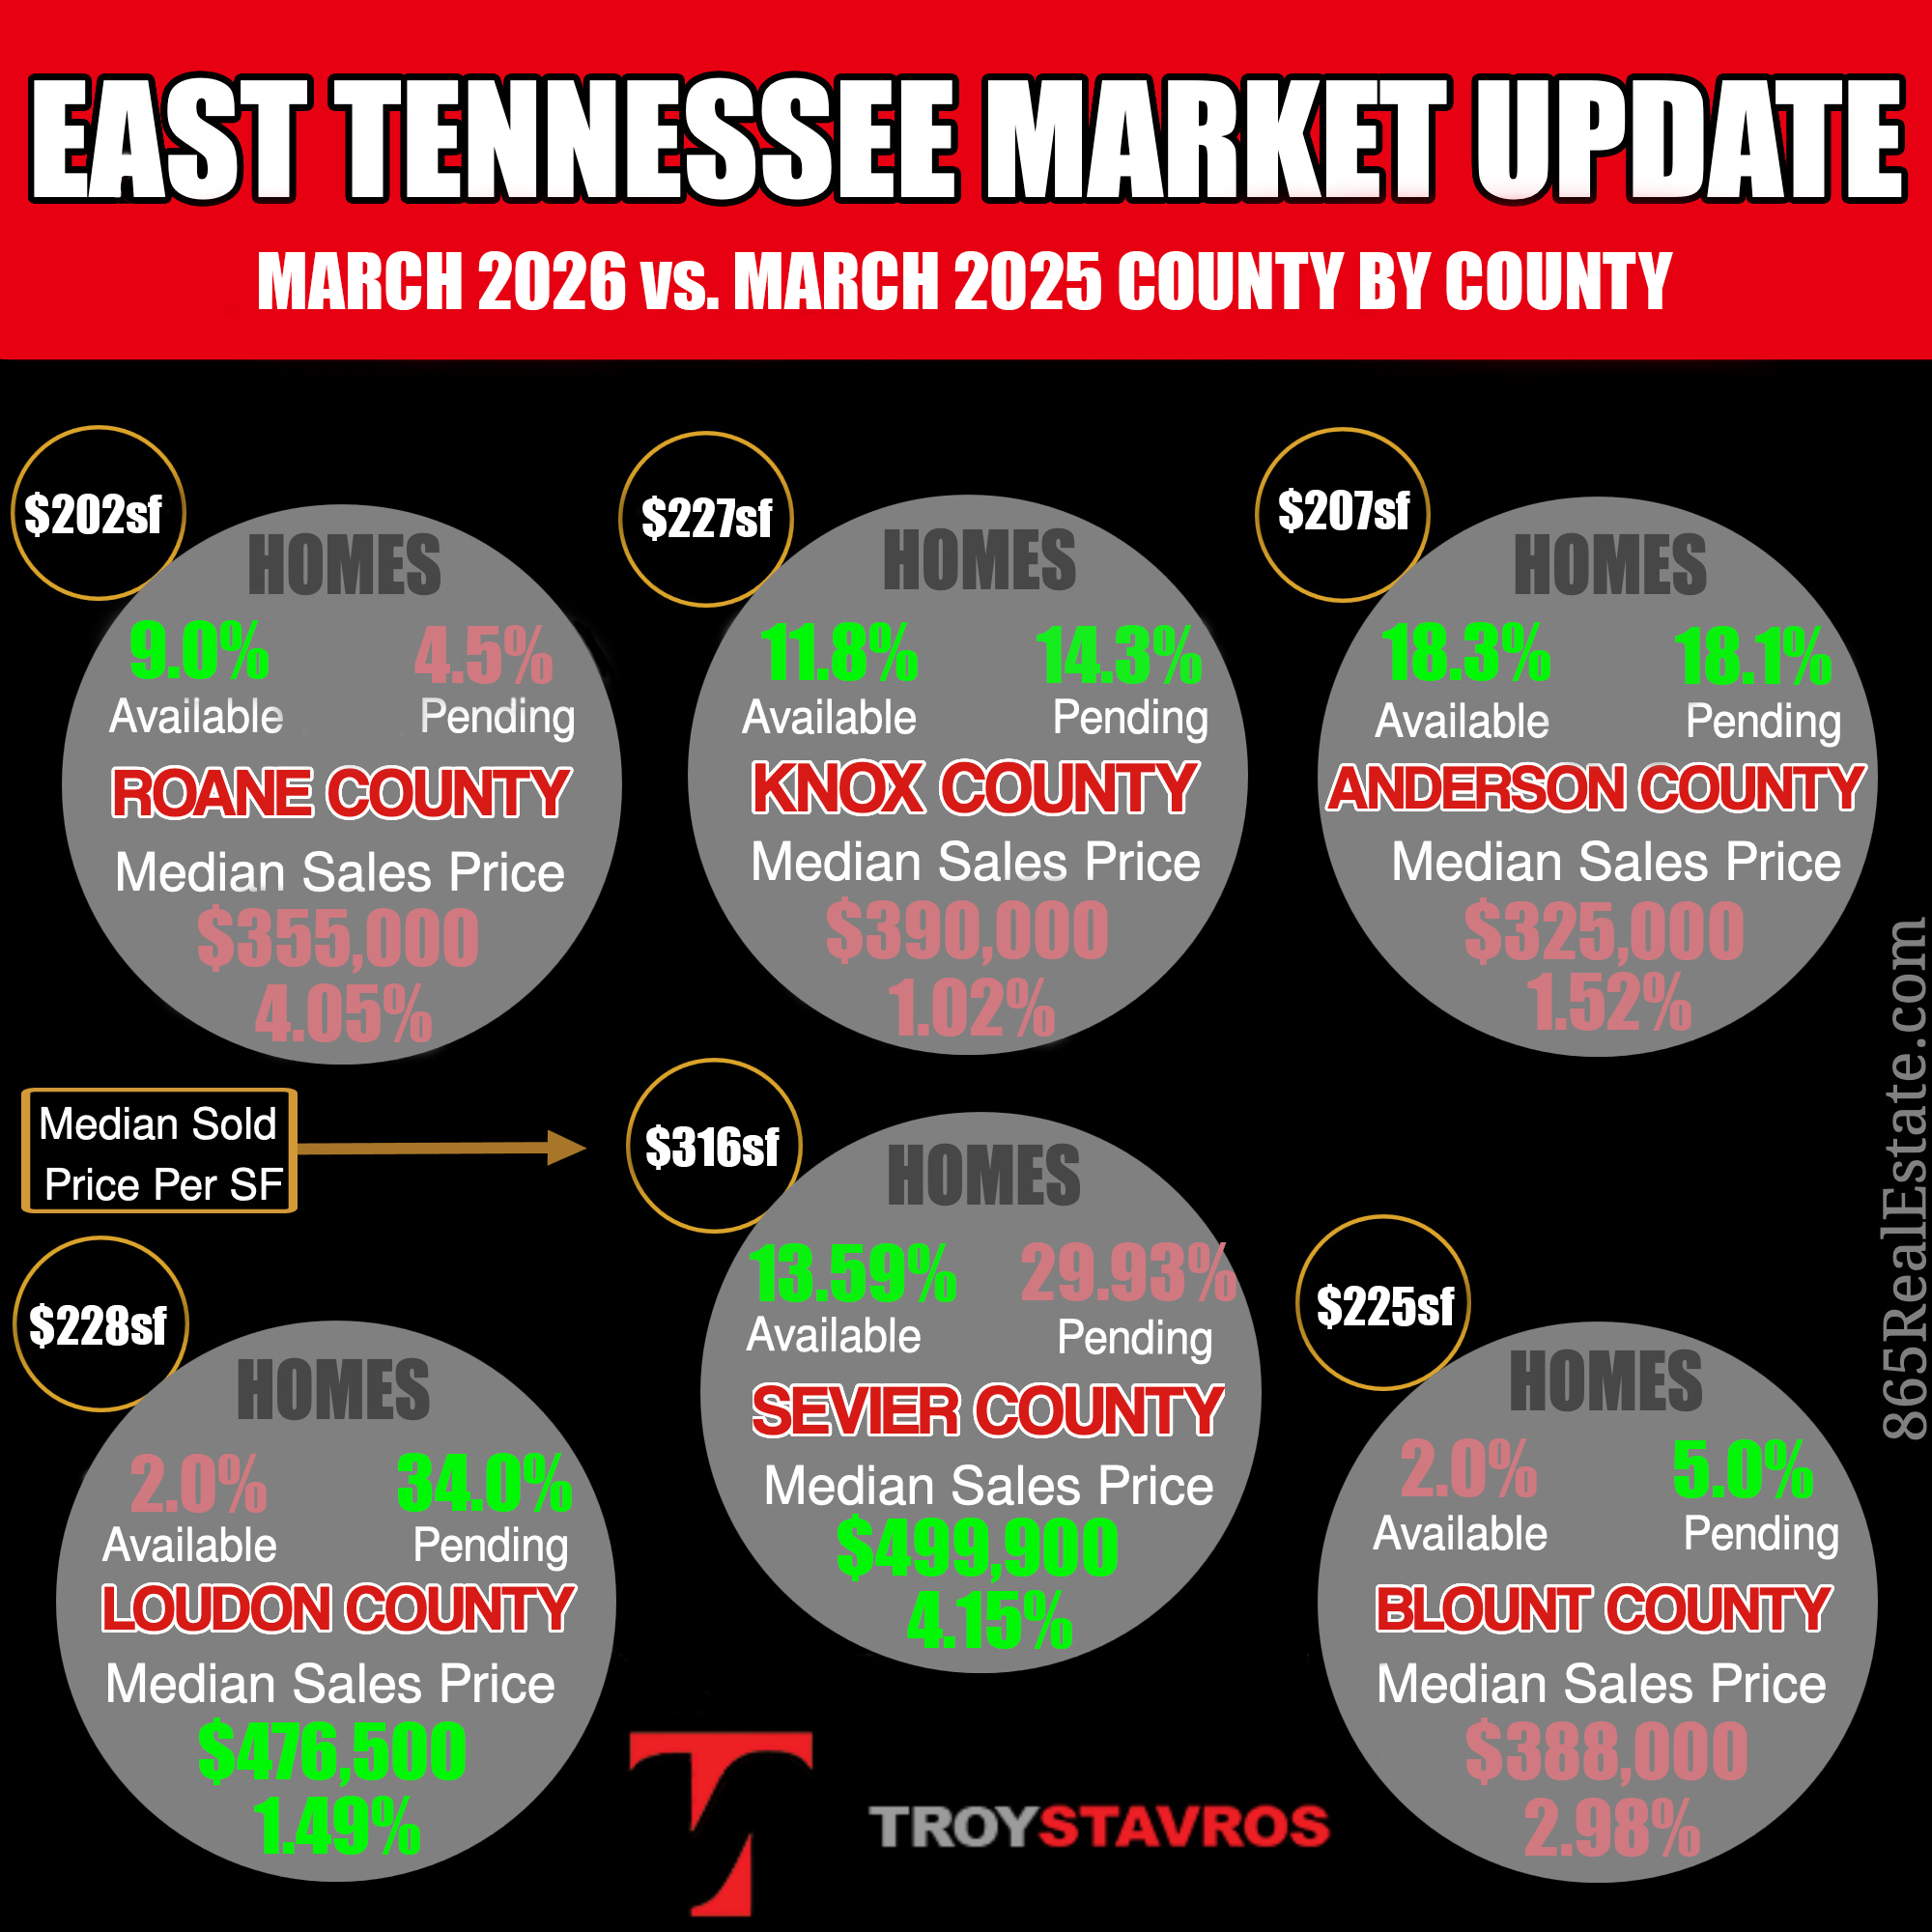
Anderson County is emerging as the clear beneficiary of price-driven migration within the region. The median sale price of $350,000 — up 11.1% year over year — still offers a significant discount relative to Knox, Blount, and Loudon counties, and buyers are responding.
Pending sales surged 35.0% to 108 contracts, one of the strongest pending increases in the region. That demand, however, hasn’t fully translated into closings yet, which declined 6.2% to 75 units. The median days on market is 32, and the absorption rate of 2.95 months keeps Anderson County just inside seller’s market territory.
The story here is about value-seeking buyers who can no longer afford the $400,000-plus price tags in adjacent counties. Anderson County is absorbing that demand, and if the trend continues, expect prices to keep climbing and the absorption rate to tighten further.
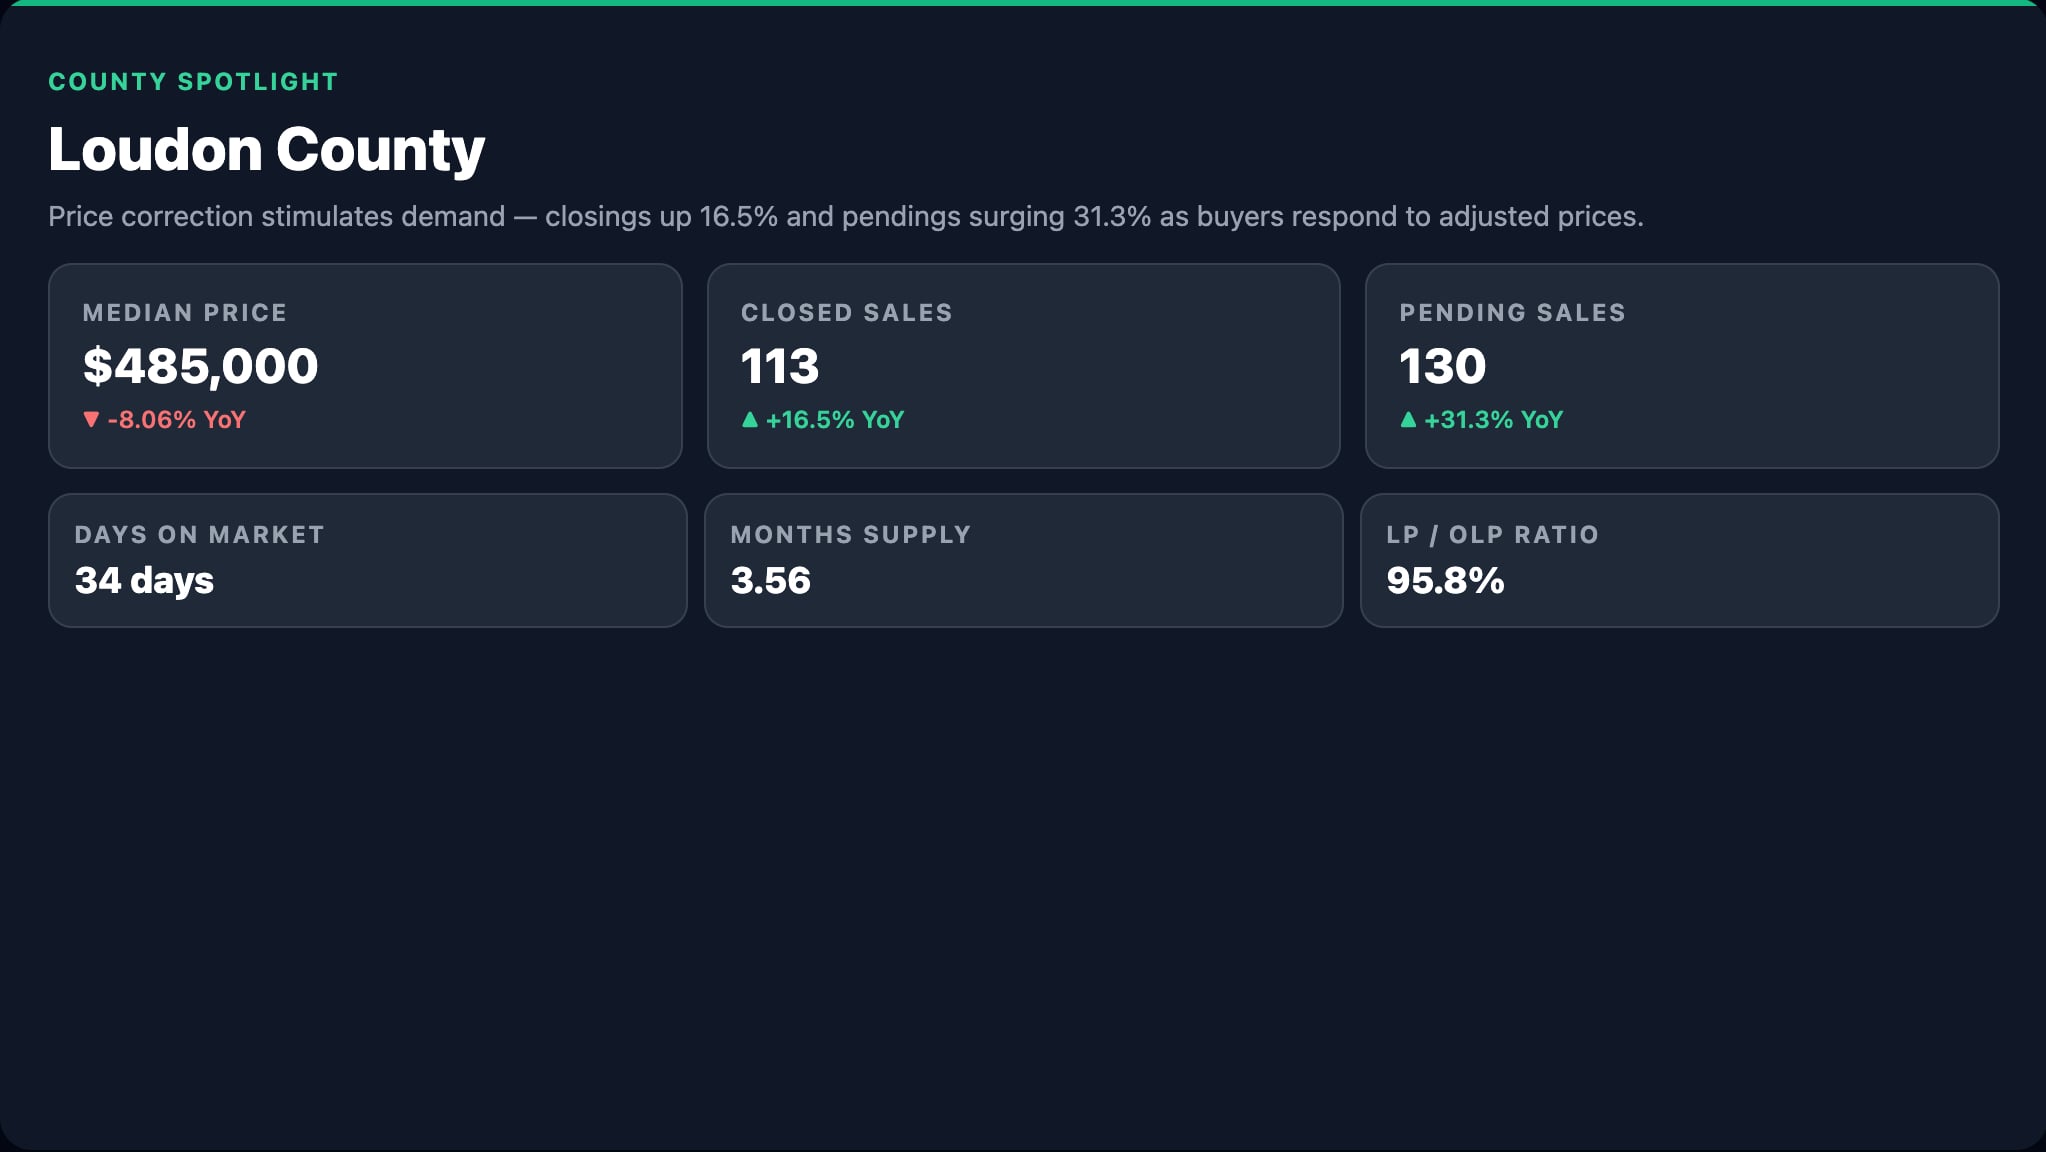
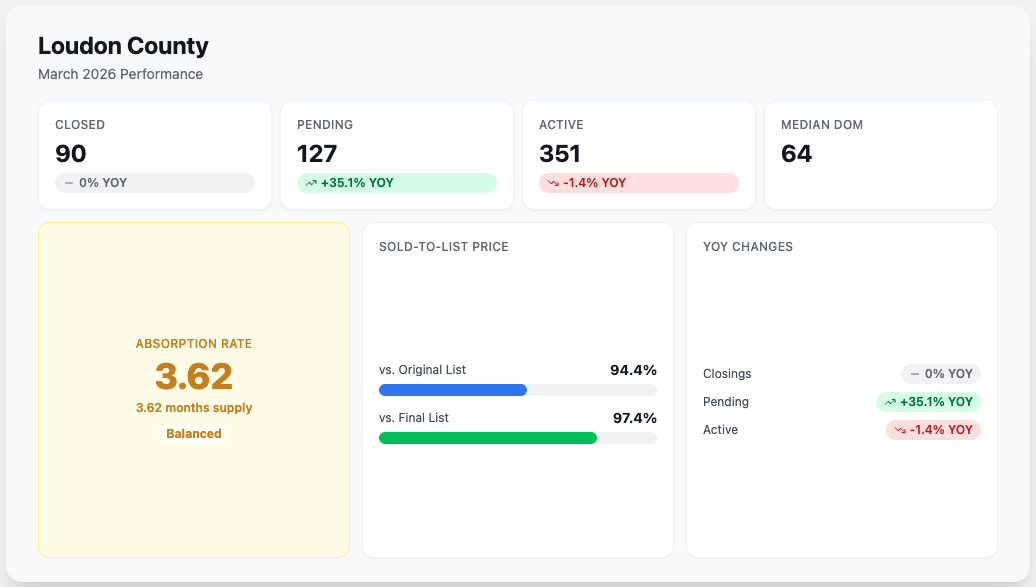
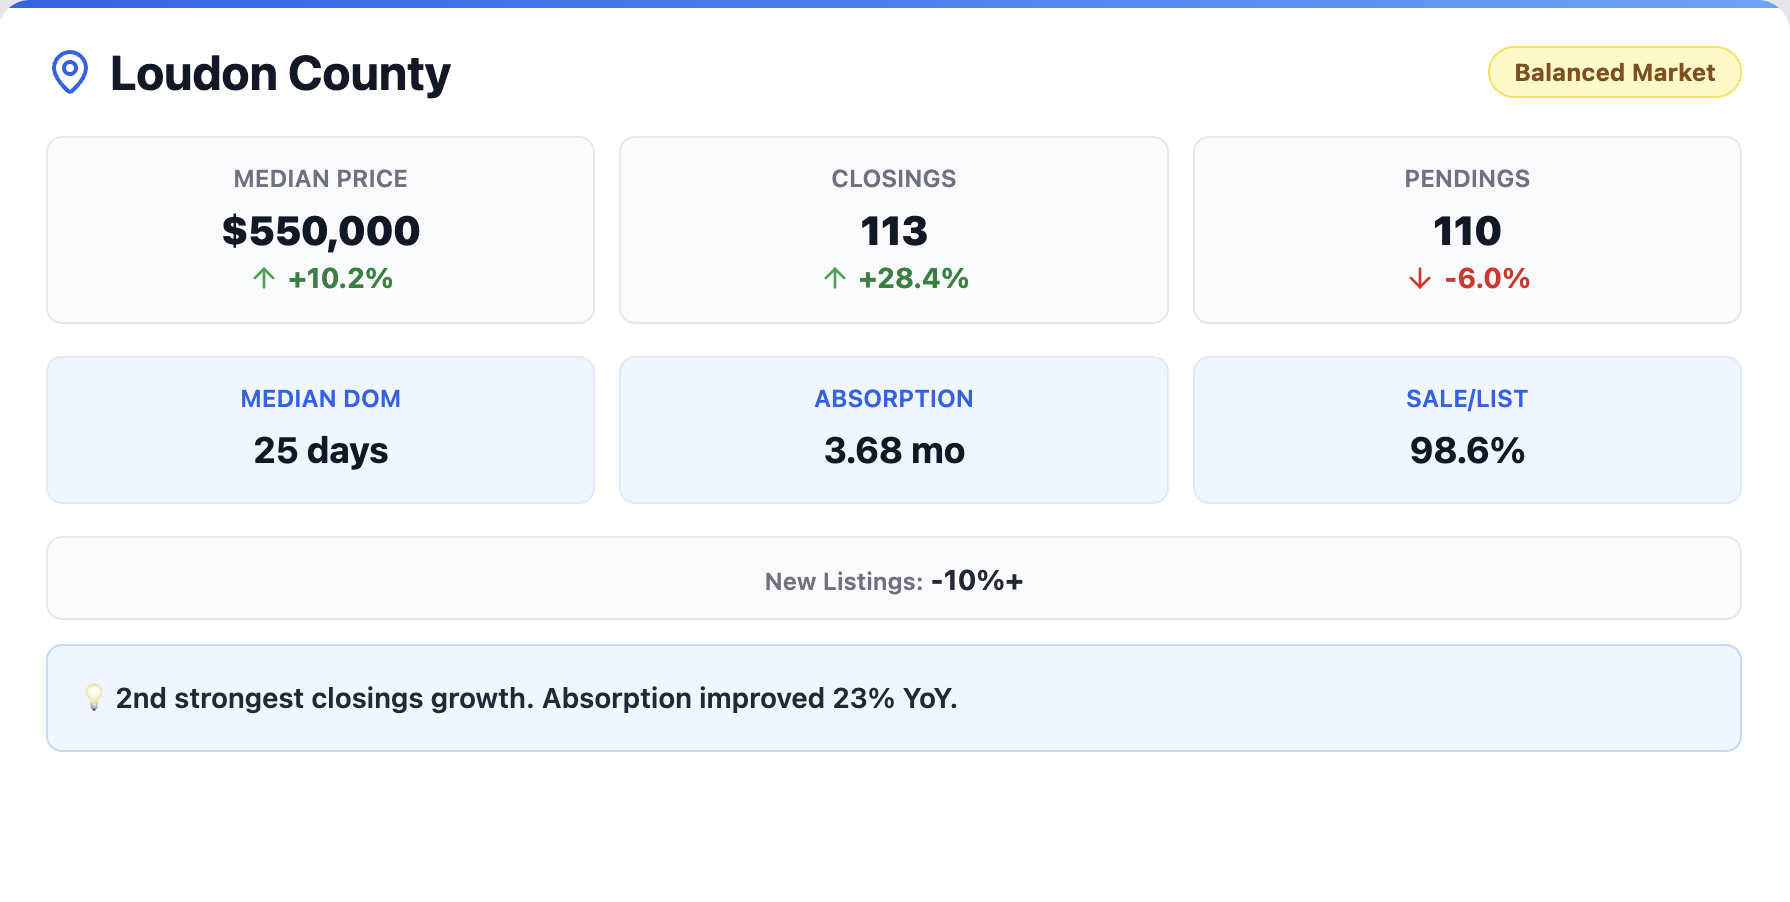
Loudon County: Strong Closings, Improving Fundamentals
Loudon County posted the second-strongest closings growth in the region at 28.4%, with 113 homes closing in May. The median sale price hit $550,000, up 10.2% year over year, and the sale-to-list ratio of 98.6% suggests that sellers are getting close to their asking prices while leaving just enough room for negotiation.
Pending sales dipped 6.0% to 110, which may reflect the absorption of the closings surge rather than a decline in demand. The absorption rate of 3.68 months places Loudon County in balanced market territory, and that rate has actually improved 23% compared to the same period last year. New listings are also declining, down more than 10%, which should continue to support prices through the summer.
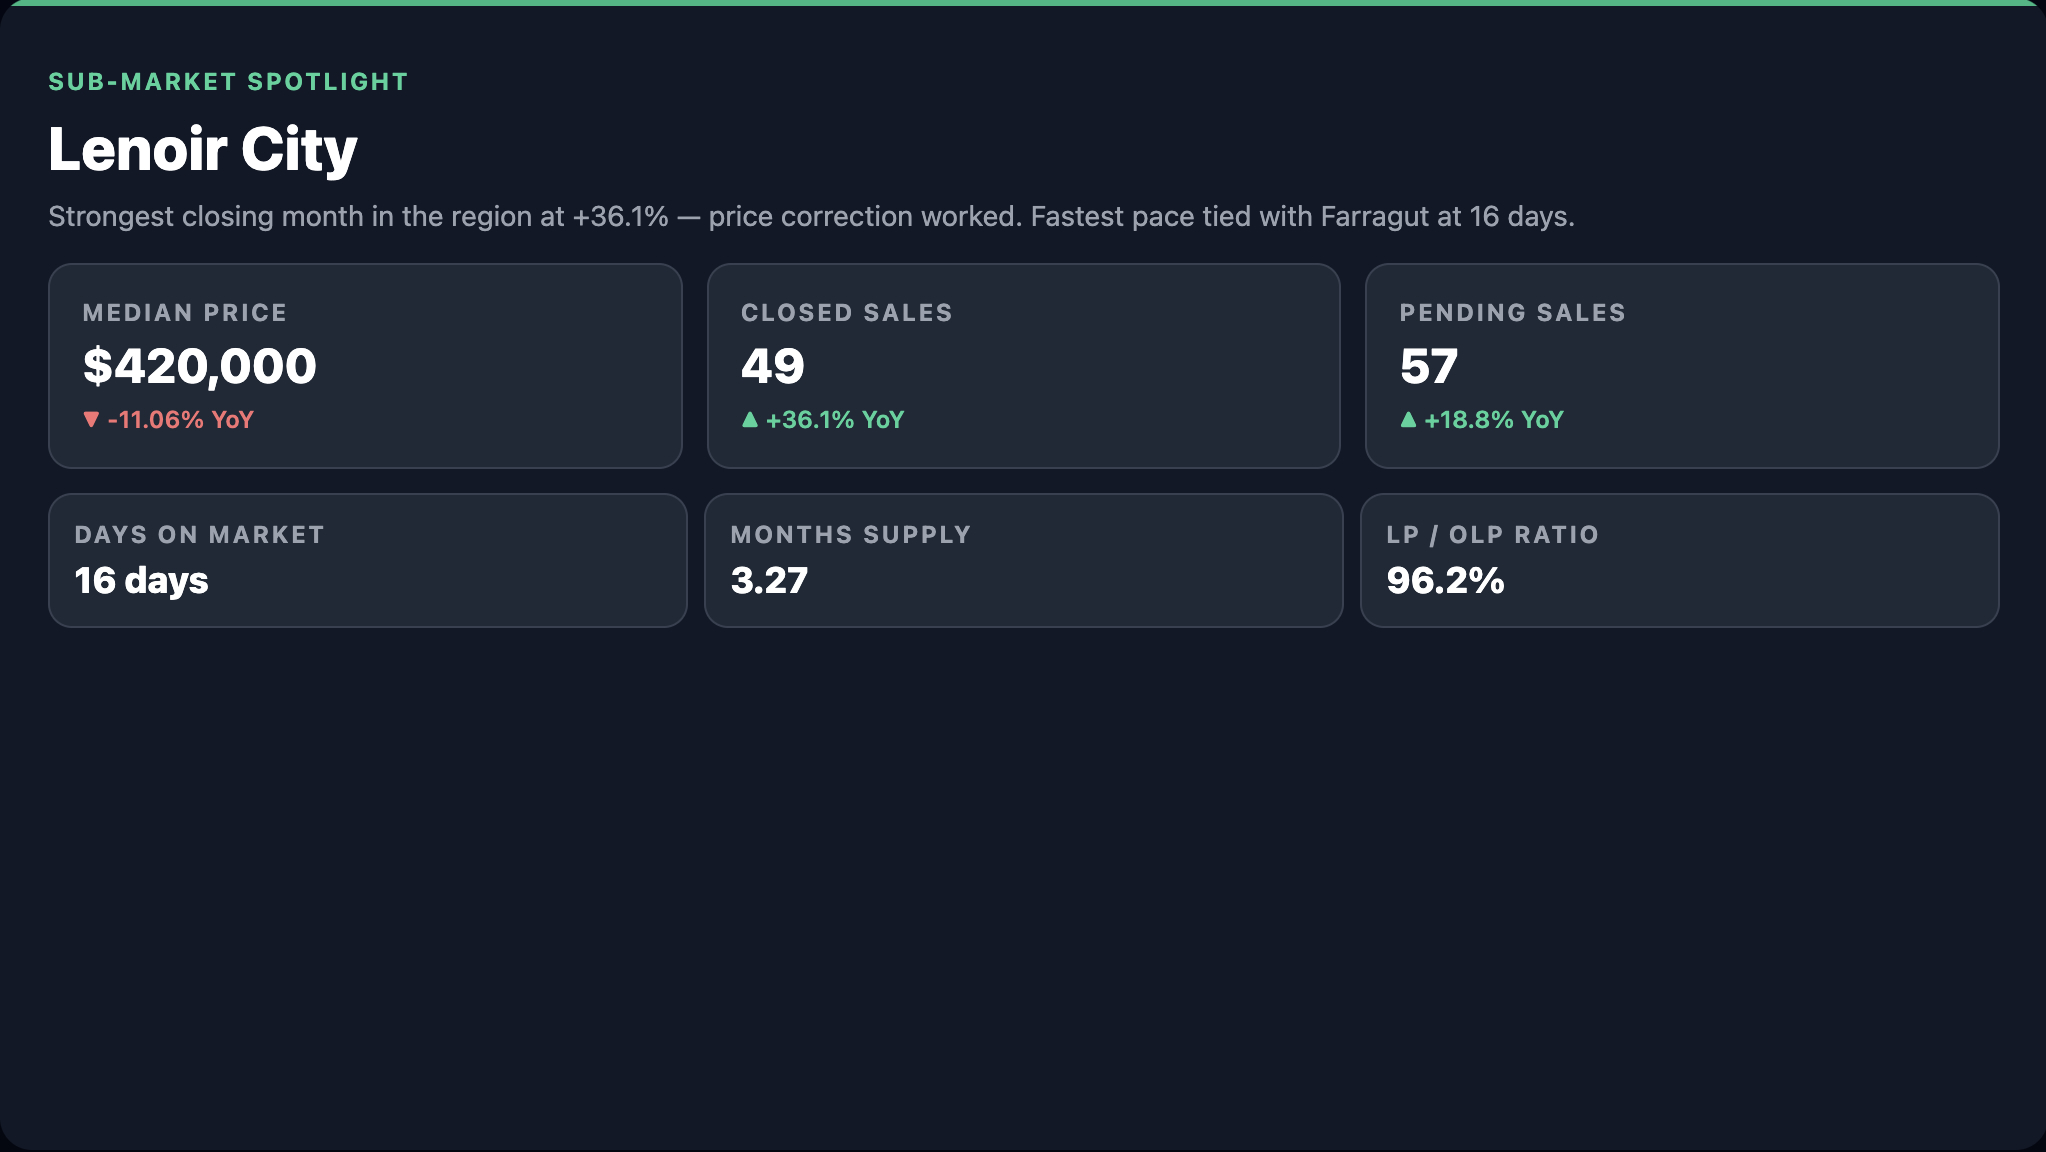
Lenoir City: A Masterclass in Pricing Strategy
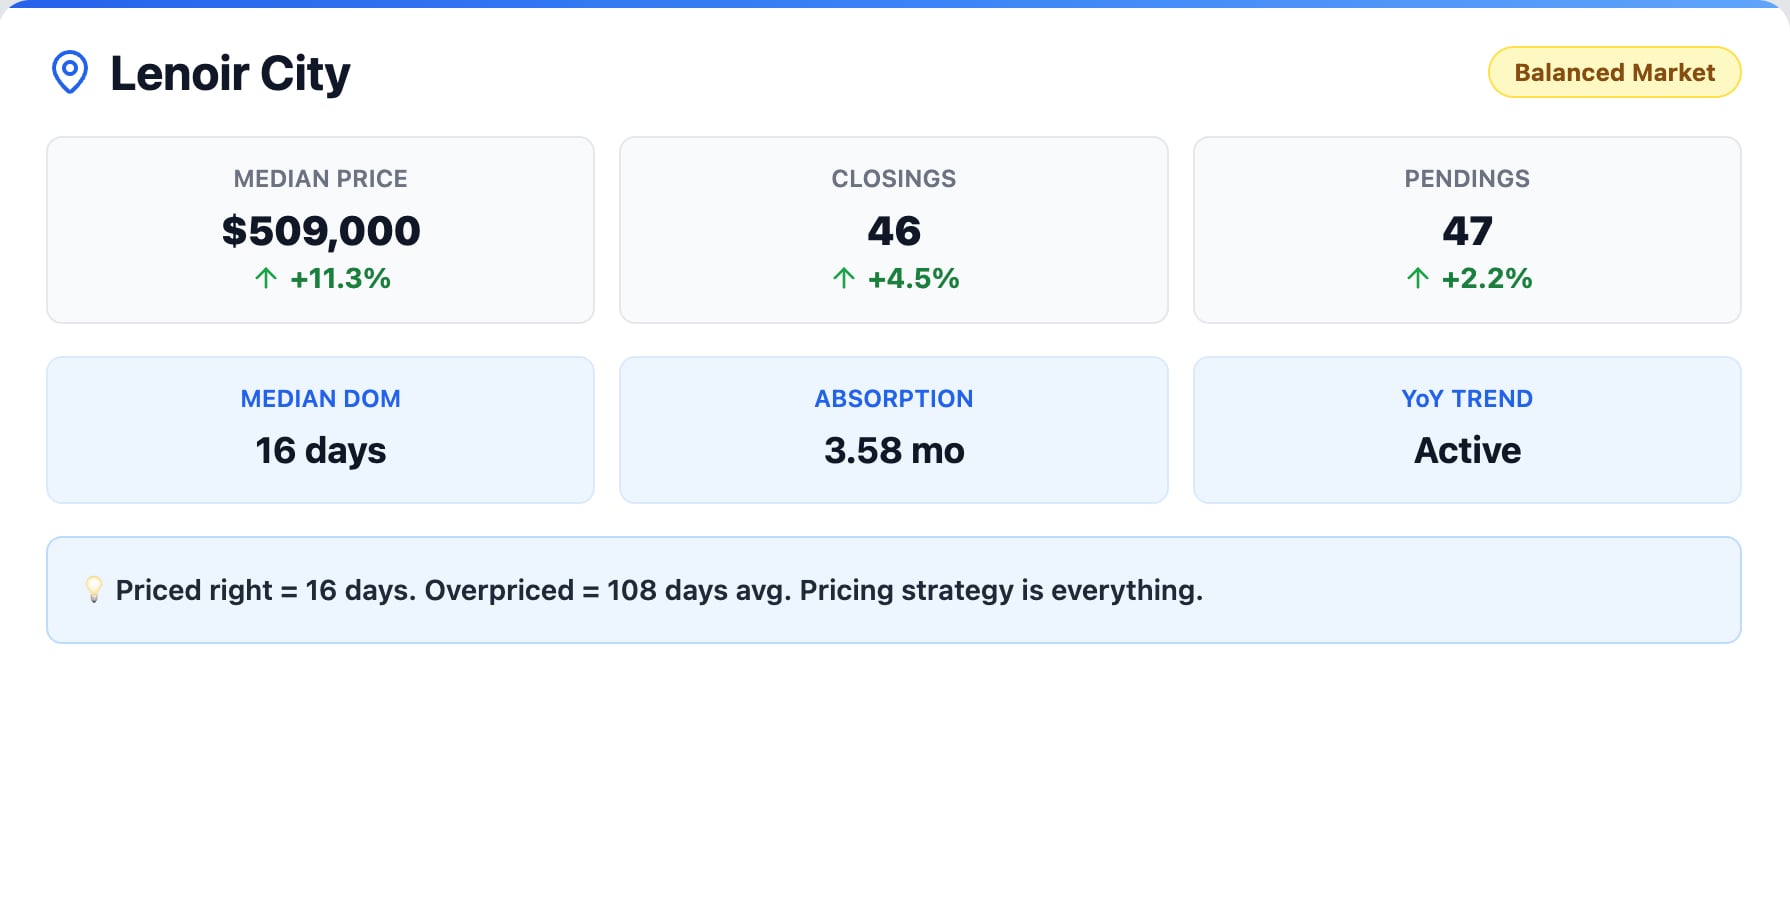
Lenoir City’s May 2026 data offers one of the most instructive lessons in the entire region. The median sale price reached $509,000, an 11.3% year-over-year gain. Closings rose 4.5% to 46 units, and pendings edged up 2.2% to 47. The absorption rate of 3.58 months indicates a balanced market.
But here is the number that every seller in Lenoir City needs to see: homes priced correctly are selling in a median of 16 days. Homes that are overpriced are sitting for an average of 108 days. That is not a small difference — it is the difference between a smooth transaction and months of carrying costs, price reductions, and mounting frustration. In a balanced market, pricing strategy is not just important — it is everything.
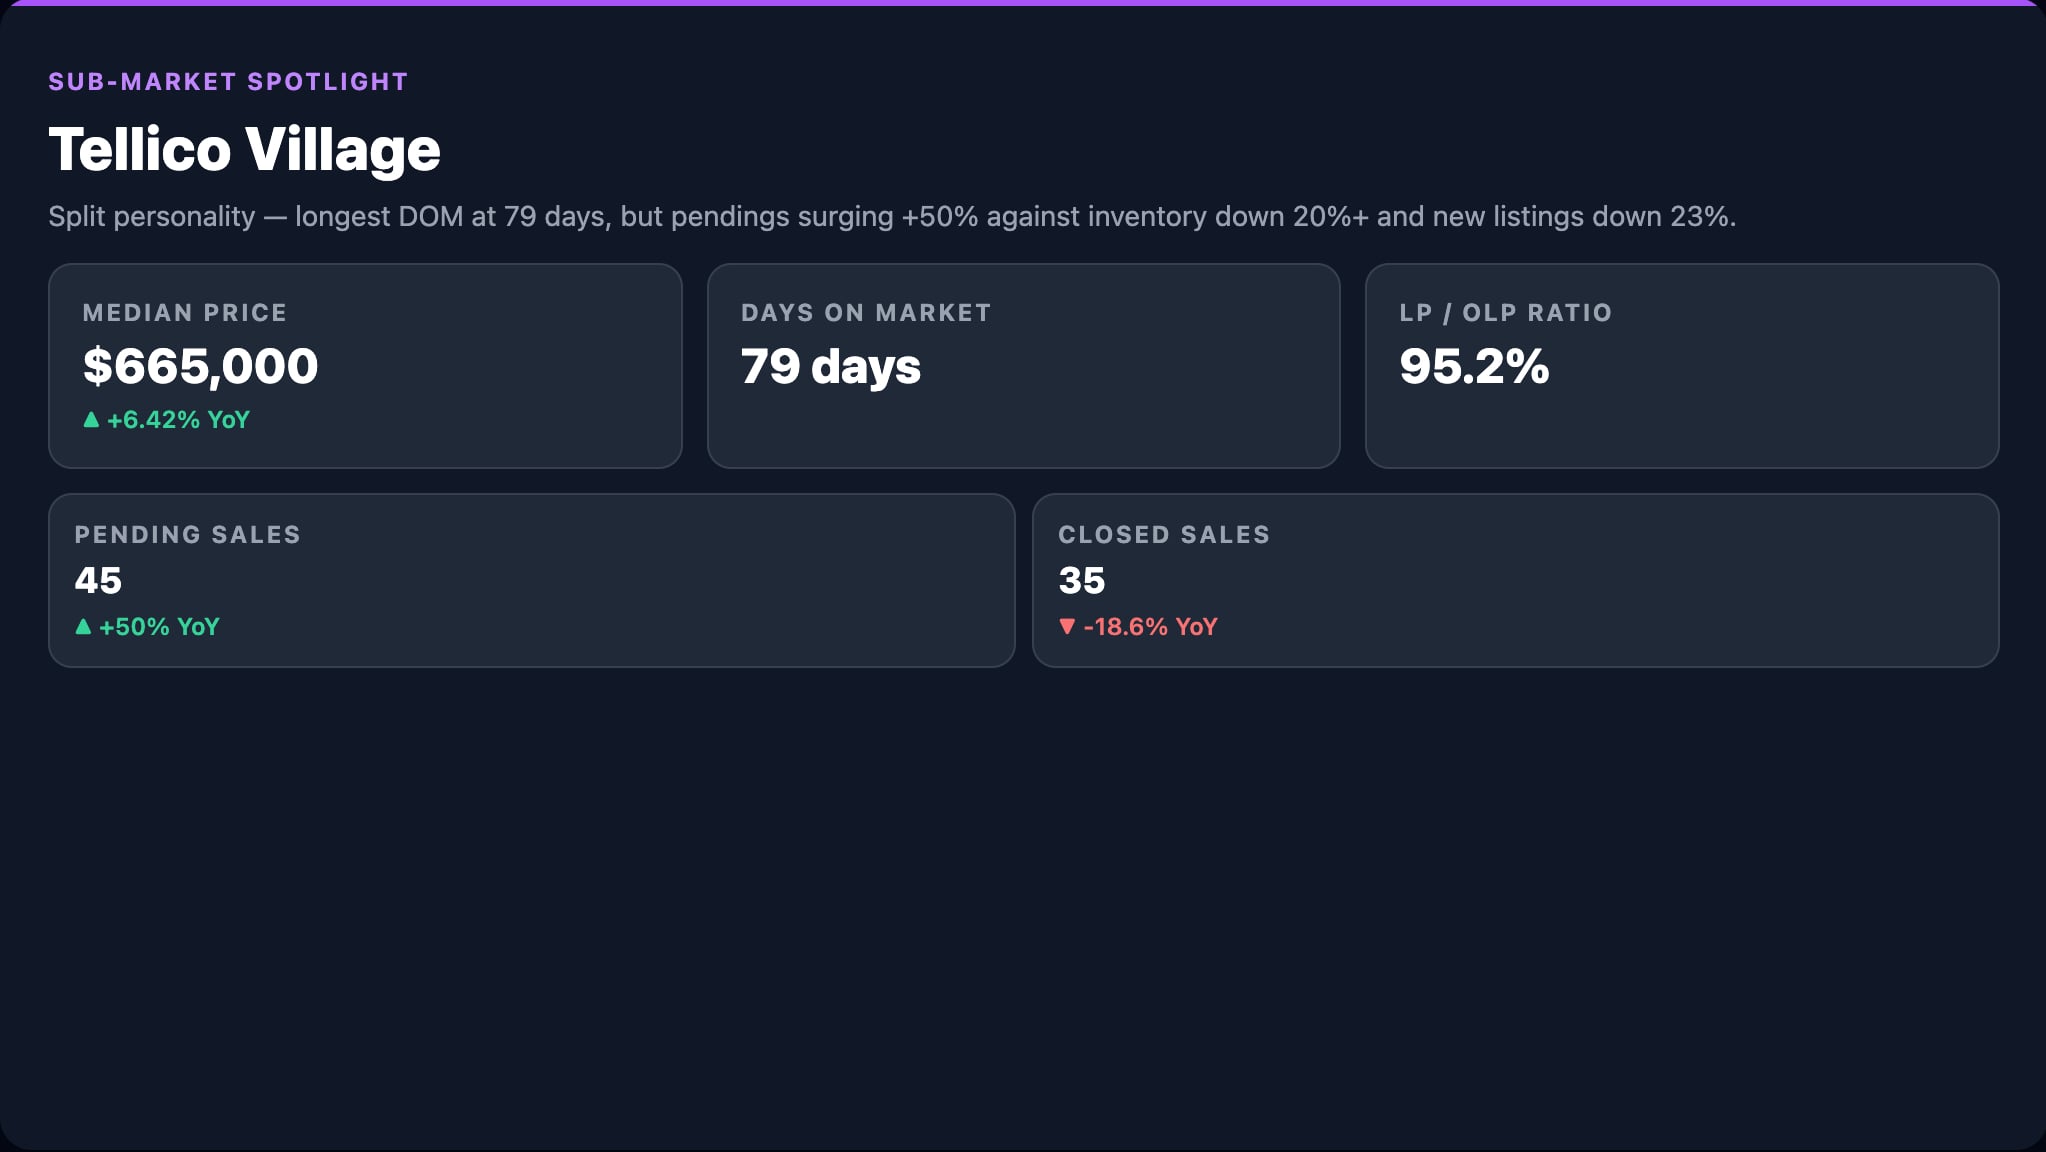
Tellico Village: Cash Buyers Drive a Closings Surge
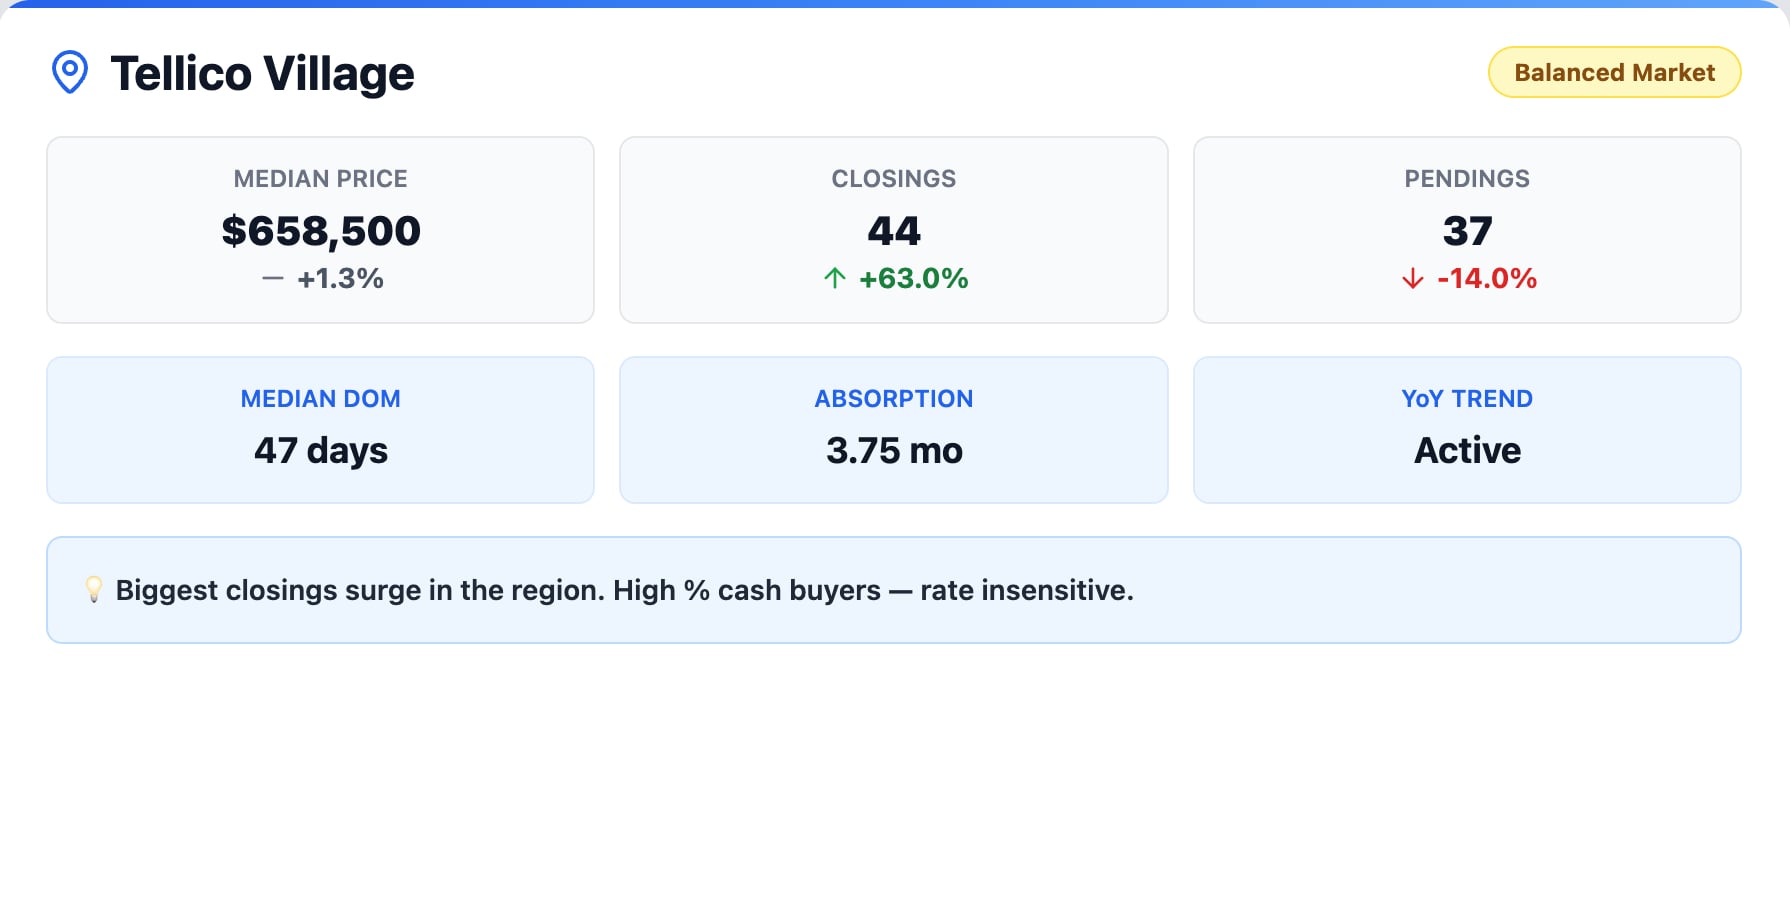
Tellico Village posted the most dramatic closings increase in the entire region, with a 63.0% year-over-year jump to 44 closed sales. The median sale price held essentially flat at $658,500, up just 1.3%, suggesting that the volume surge is not being driven by price escalation but rather by an influx of motivated and well-capitalized buyers.
Tellico Village’s buyer profile skews heavily toward retirees and second-home purchasers, many of whom are paying cash. That makes this market uniquely insulated from mortgage rate fluctuations — when your buyers don’t need a loan, the Fed’s decisions become largely irrelevant. Pending sales declined 14.0% to 37 contracts, and the absorption rate sits at 3.75 months in balanced territory, with a median of 47 days on market reflecting the higher price point and the more deliberate purchasing timeline of the community’s typical buyer.
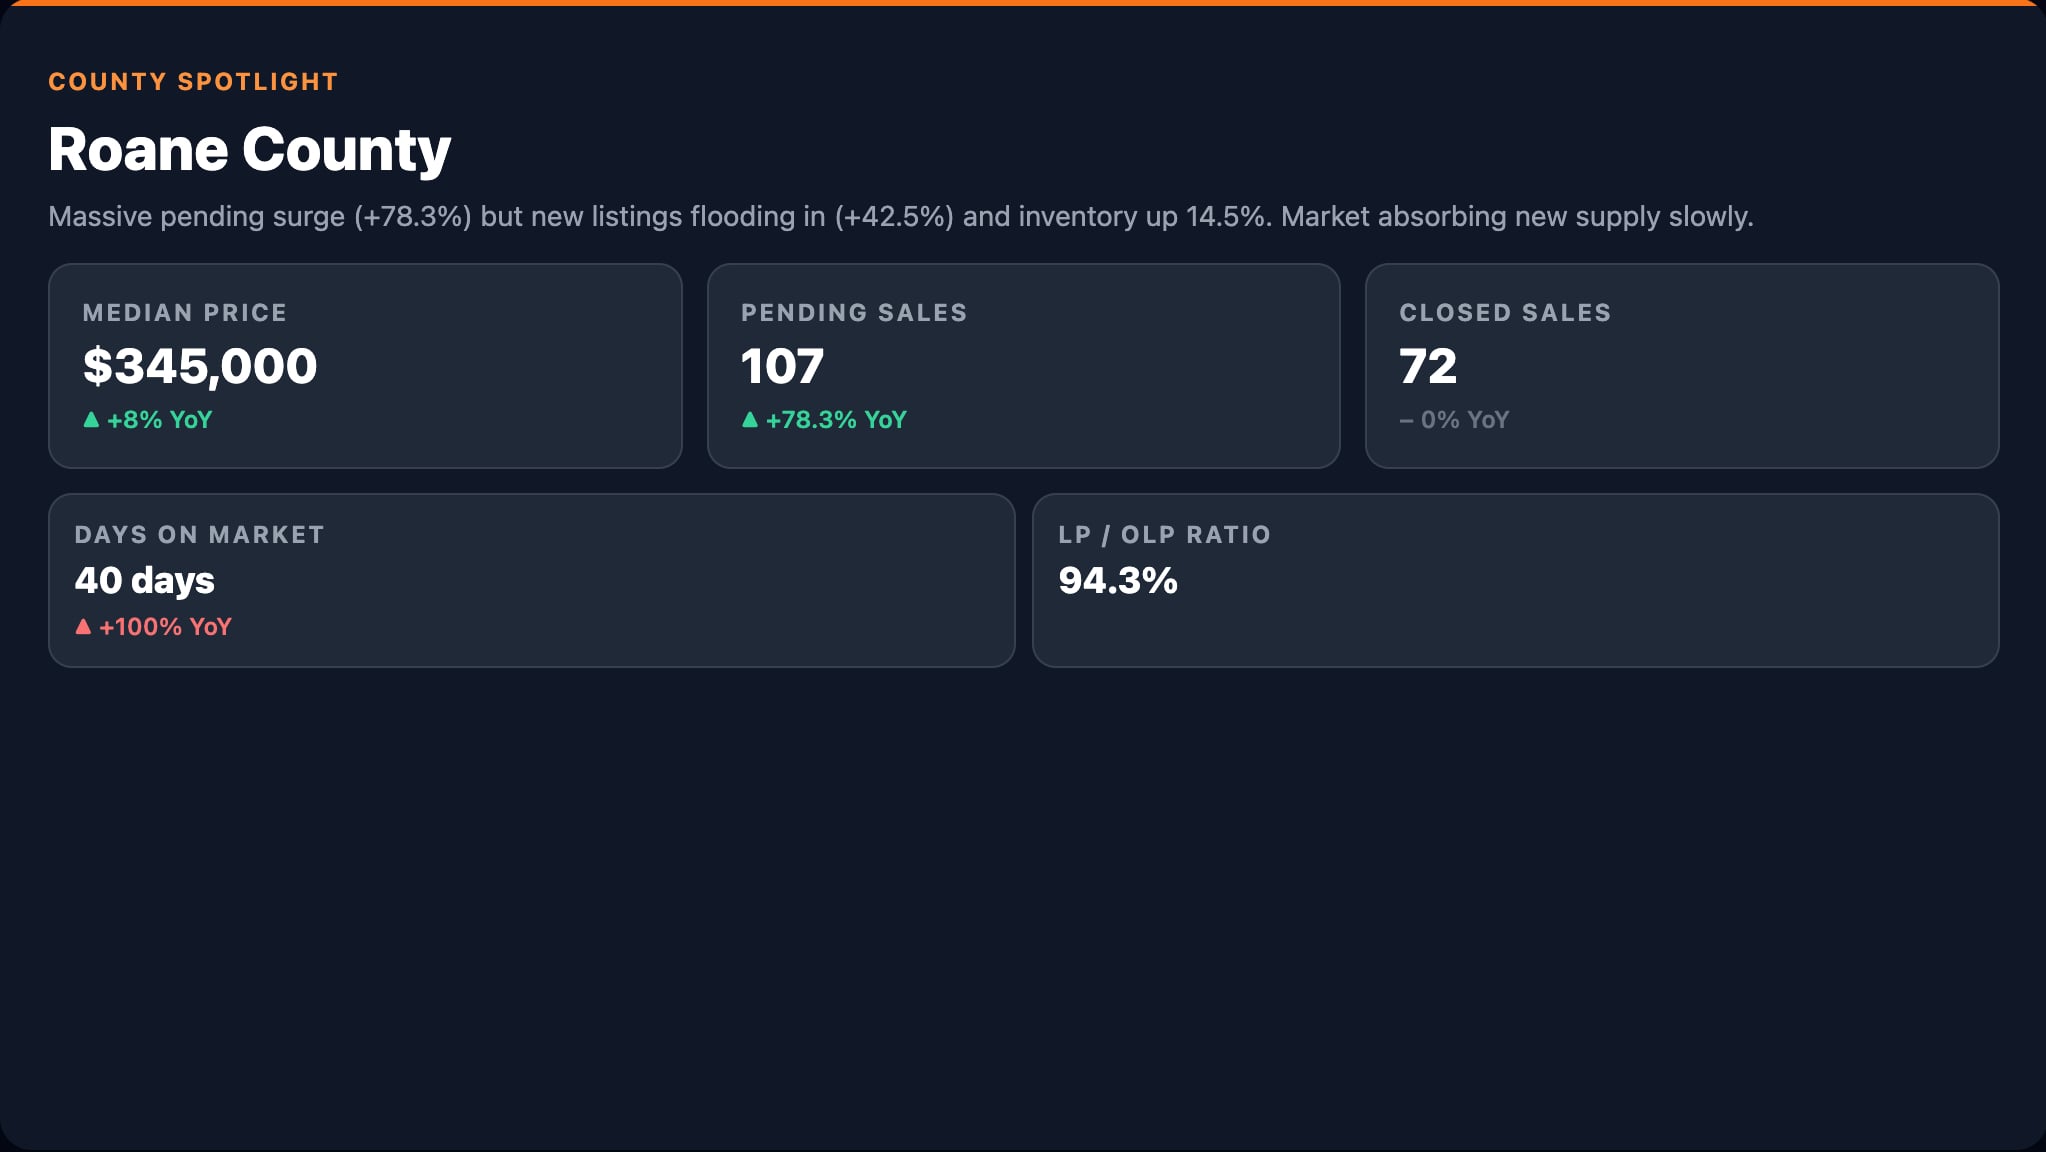
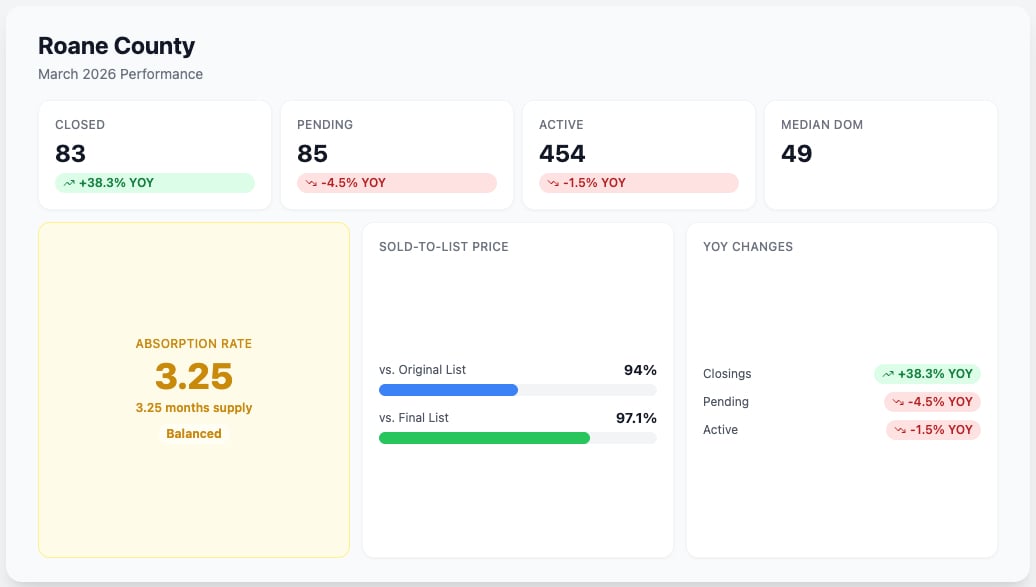
Roane County: The Region’s Best Value Play
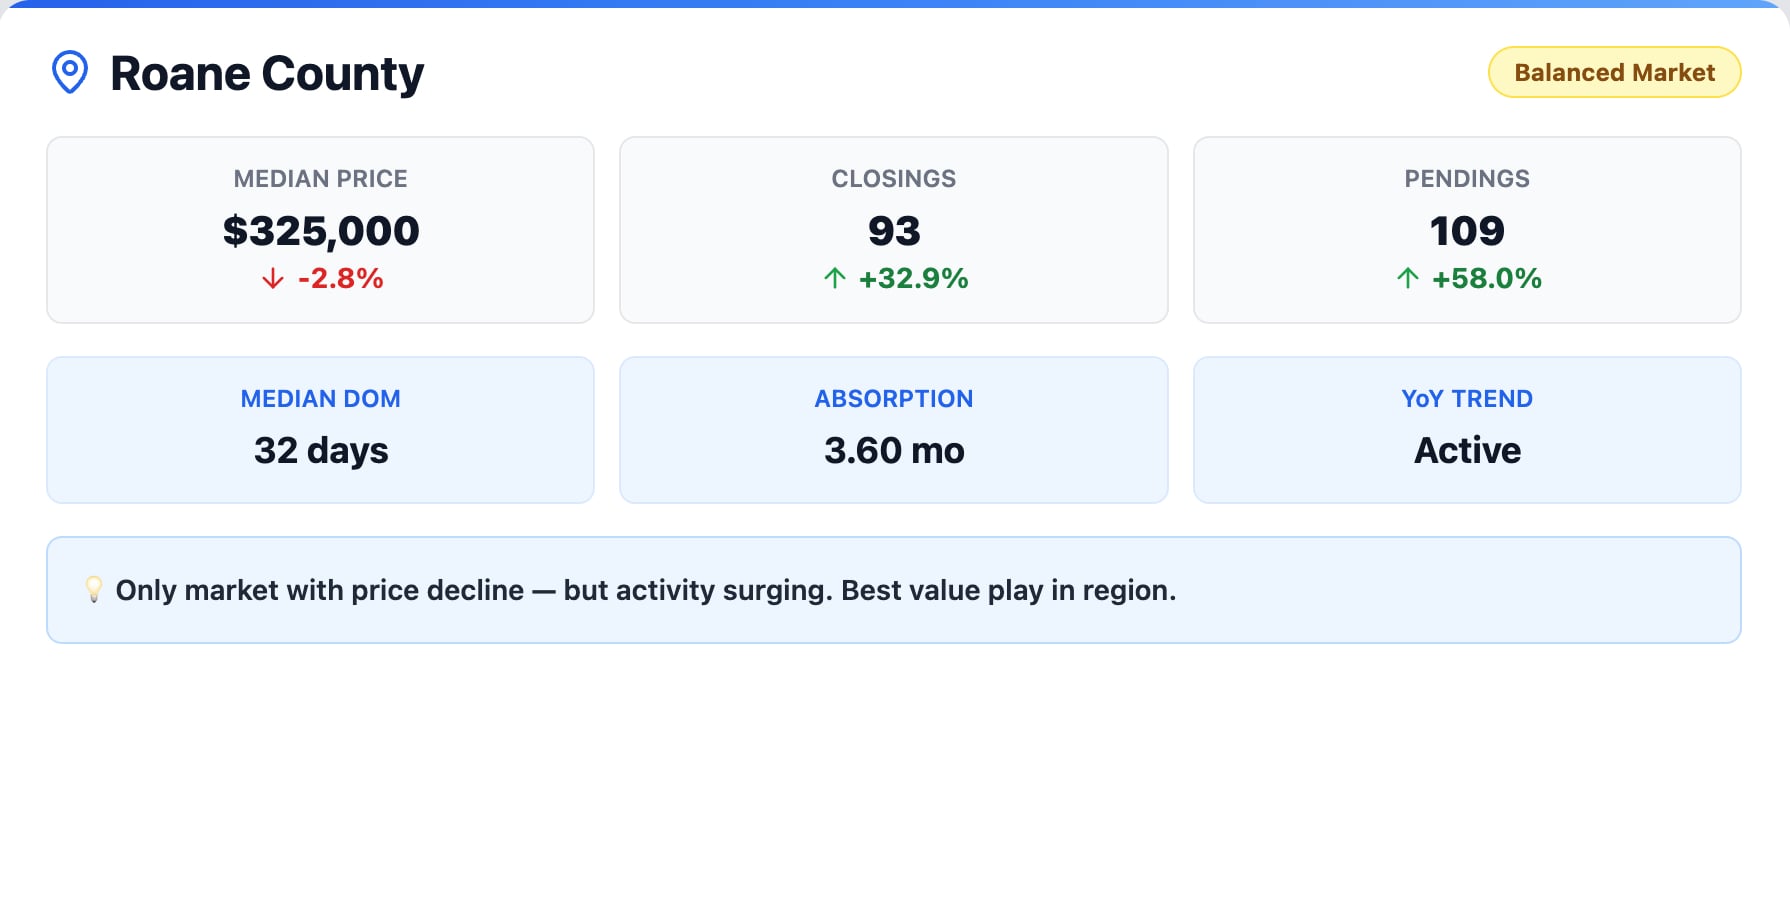
Roane County is the only market in the 9-county analysis where the median sale price declined year over year, dropping 2.8% to $325,000. But before interpreting that as weakness, look at the activity numbers. Closings surged 32.9% to 93 units. Pending sales skyrocketed 58.0% to 109 contracts. Buyers are flooding into Roane County.
At $325,000, Roane County offers the lowest median price in the region, and the combination of declining prices and surging activity is the textbook signature of a market where buyers perceive outstanding value. The median days on market is 32 with an absorption rate of 3.60 months, placing the market in balanced territory. For buyers who prioritize affordability and are willing to trade proximity for price, Roane County is the standout opportunity in East Tennessee right now.
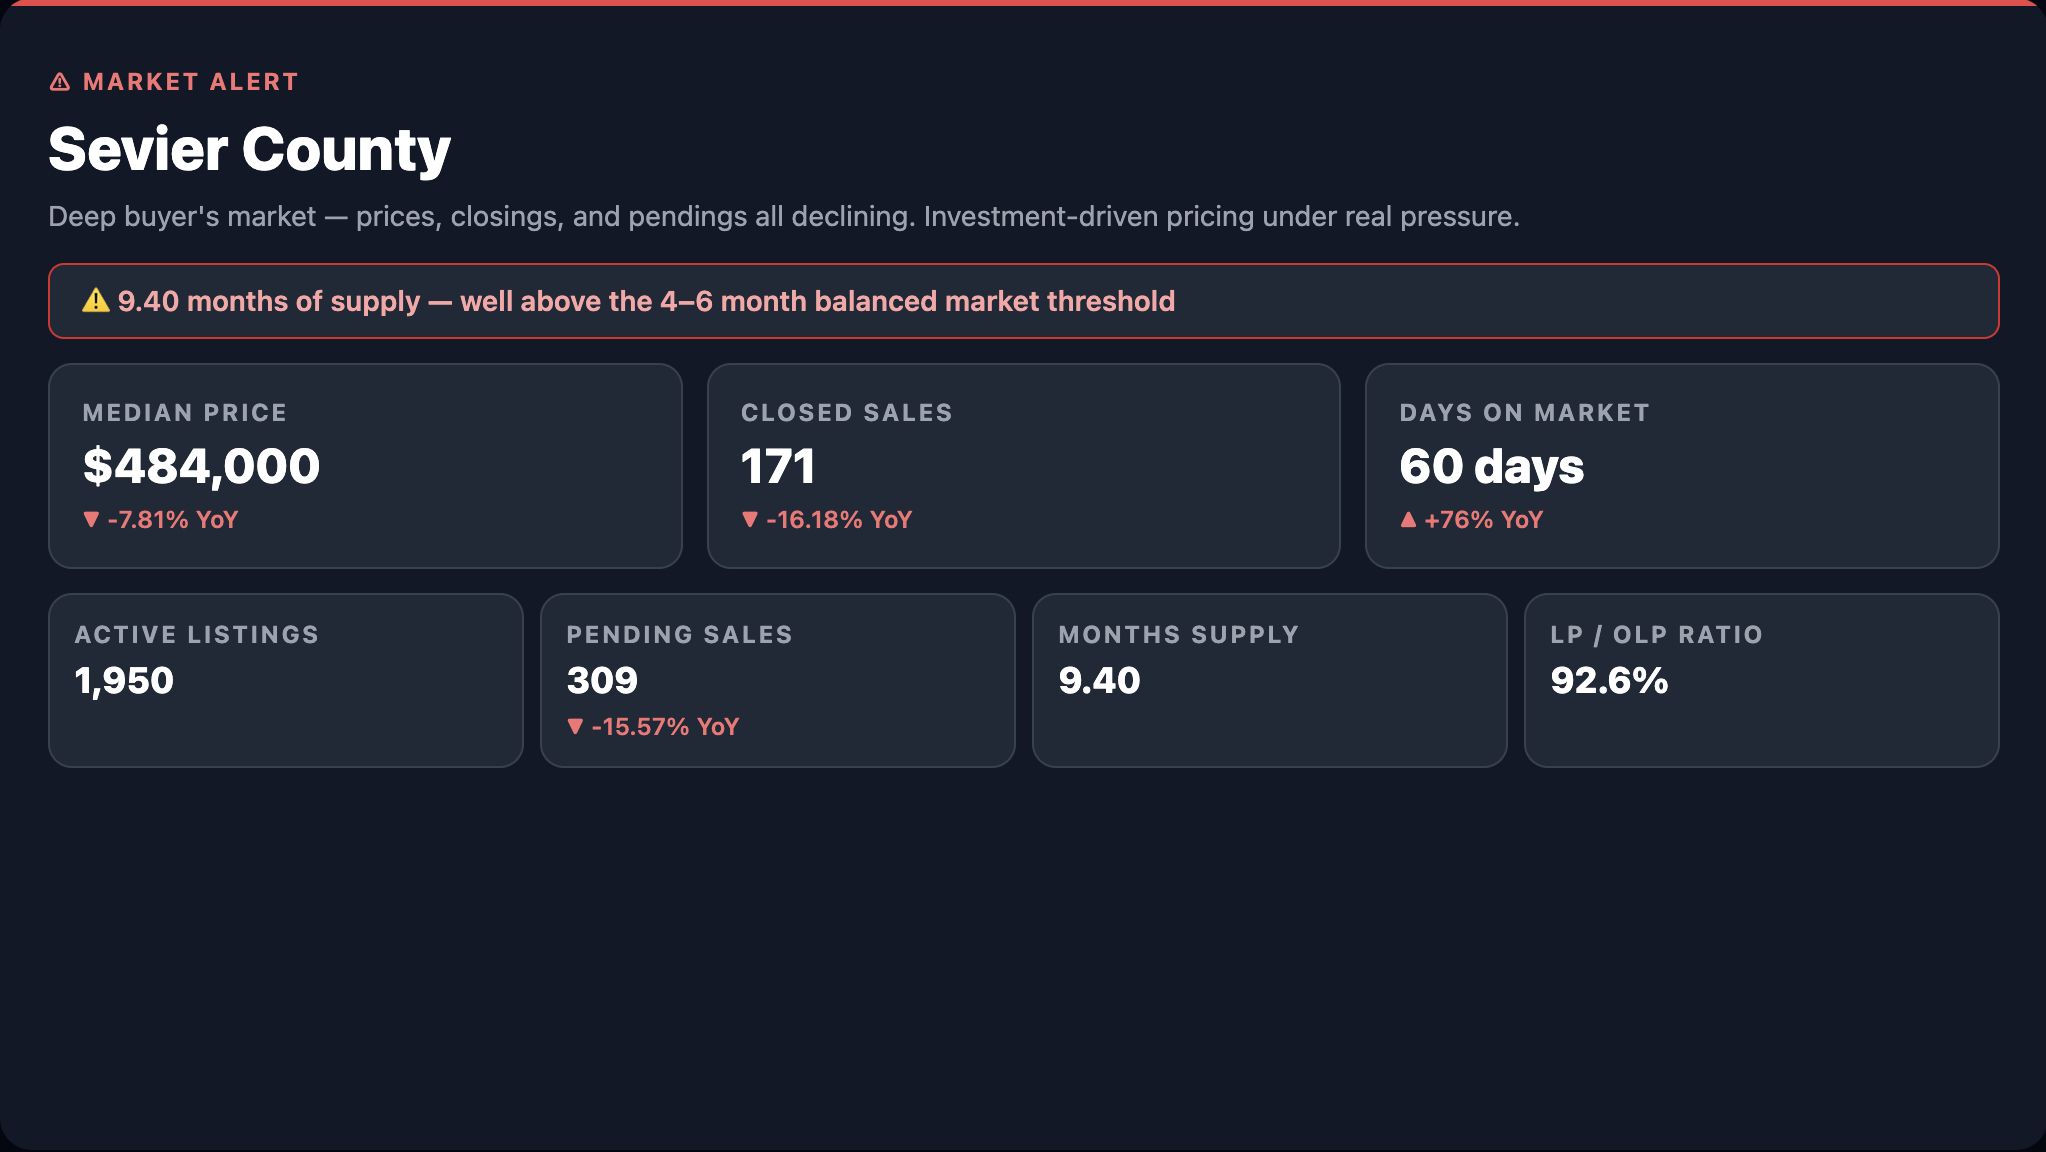
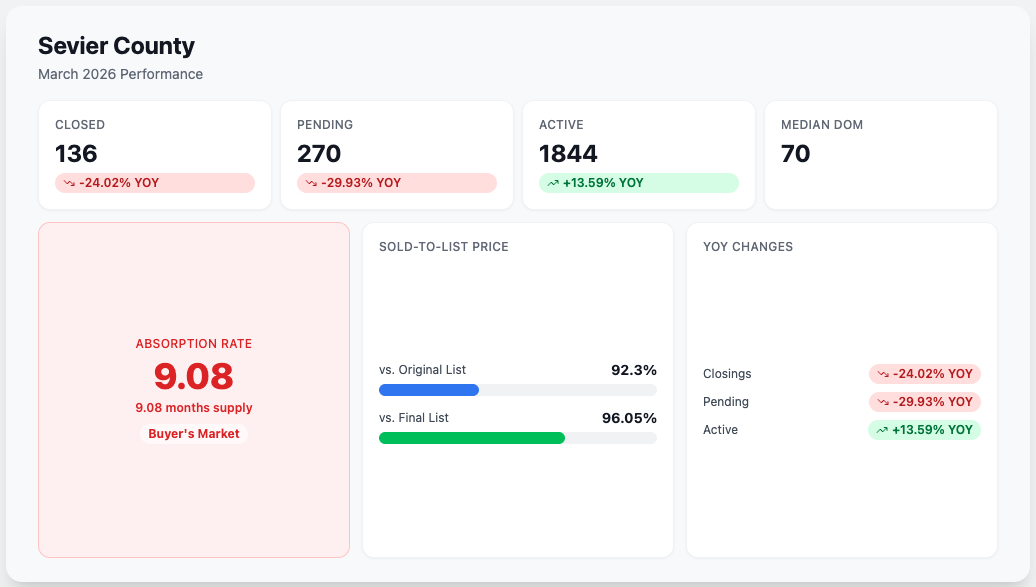
Sevier County: The Outlier That Demands a Different Strategy
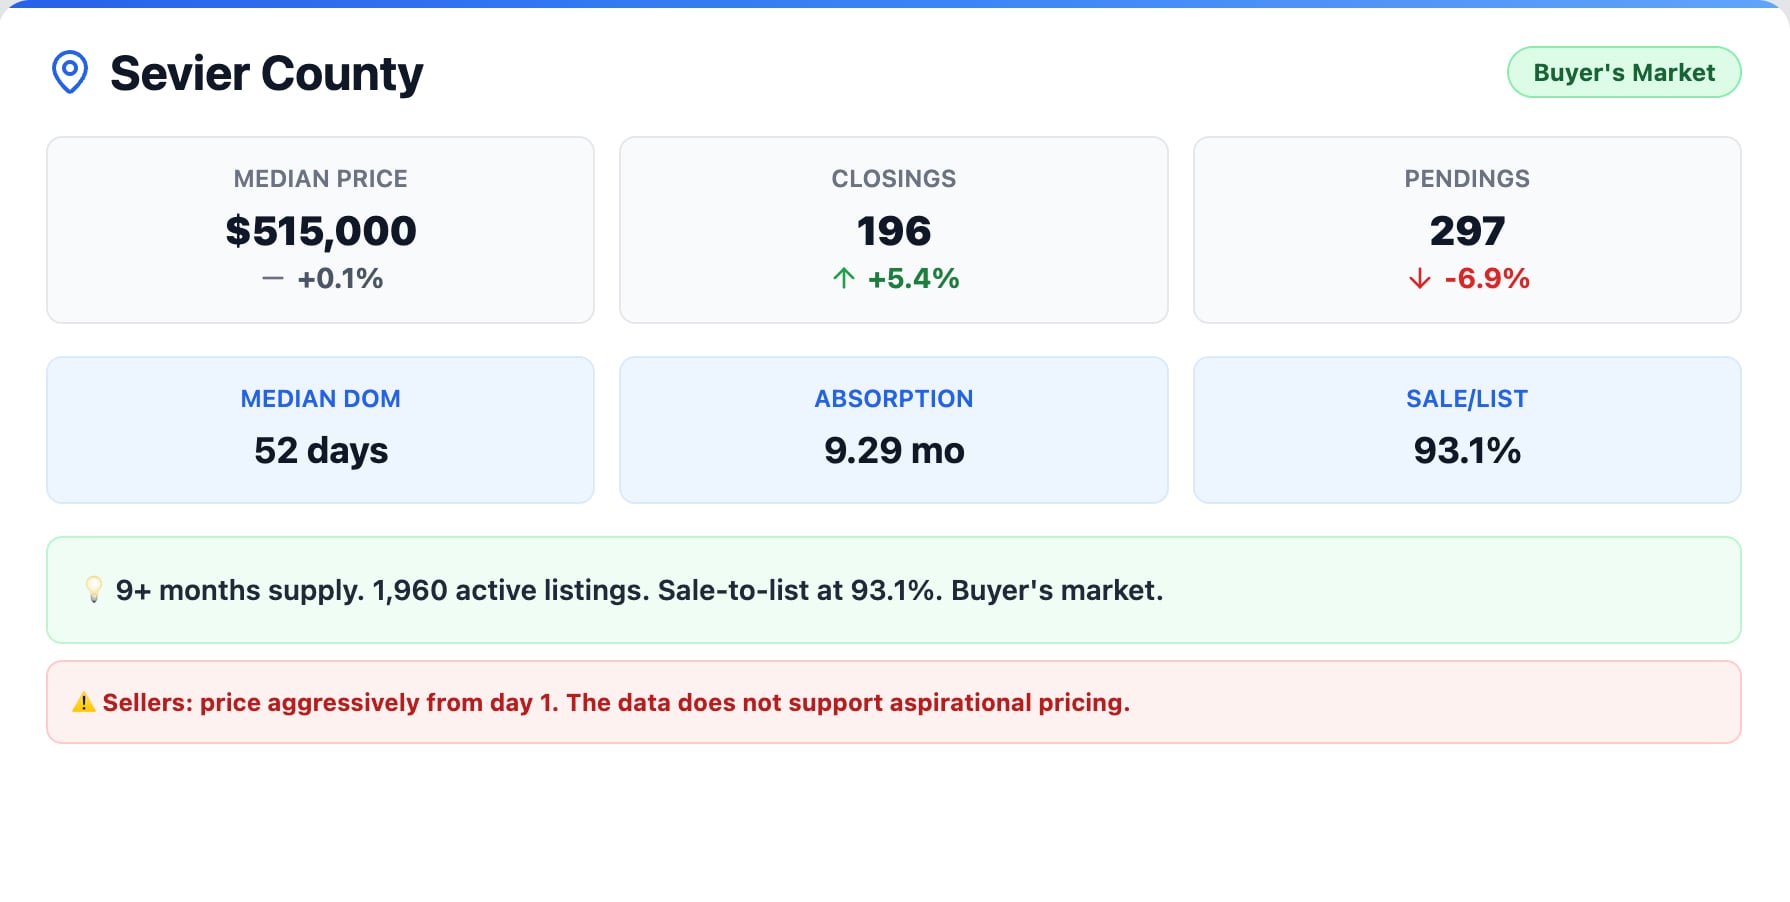
Sevier County is operating in a fundamentally different reality than the rest of the region, and the numbers make that abundantly clear. The absorption rate is 9.29 months — more than triple the rate of Knox County and nearly 4 times that of Farragut. There are approximately 1,960 active listings on the market. The sale-to-list price ratio has slipped to 93.1%, meaning sellers are accepting nearly 7% less than their asking price on average. The median days on market is 52, and the median sale price of $515,000 is essentially flat year over year at just 0.1%.
Closings did rise 5.4% to 196 units, but pending sales declined 6.9% to 297, suggesting the forward pipeline may be softening. This is a buyer’s market by every meaningful metric, driven largely by the concentration of short-term rental properties and investment homes that have accumulated over the past several years.
Sellers in Sevier County need to internalize a difficult truth: the data does not support aspirational pricing. Homes that are priced aggressively from day 1 will find buyers. Homes that are priced based on what the seller hopes the market will pay — rather than what comparable sales demonstrate — will sit, accumulate days on market, and ultimately sell for less than they would have if priced correctly from the start.
What This Means for Buyers and Sellers in East Tennessee
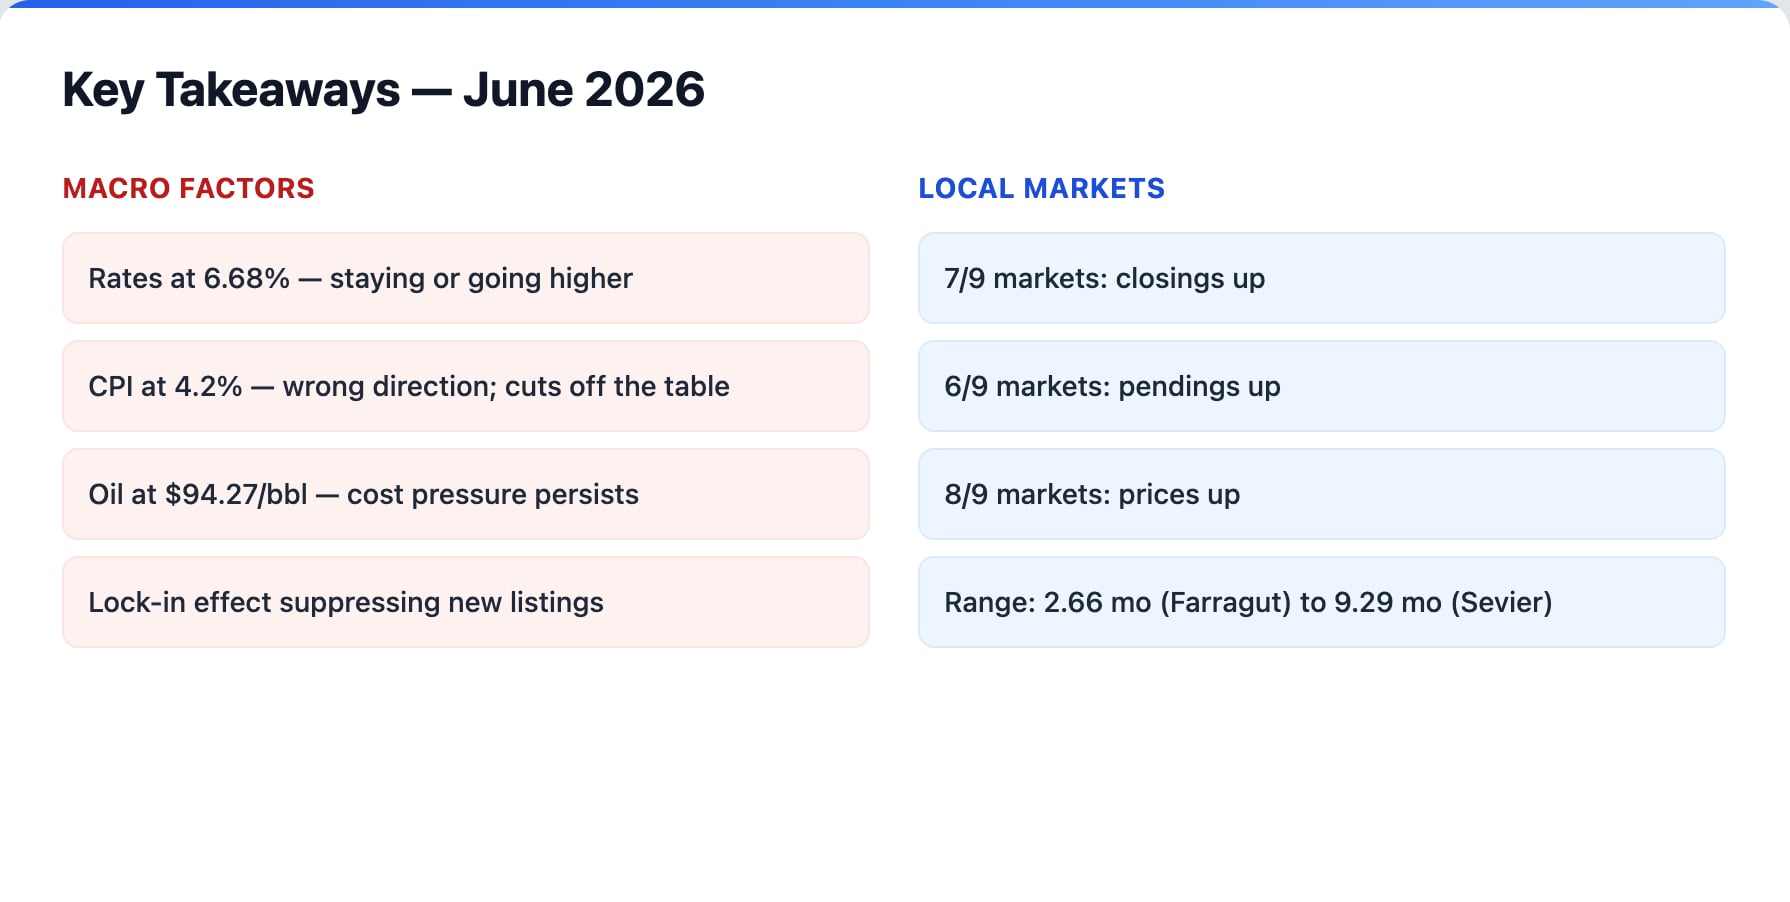
The June 2026 East Tennessee housing market is defined by a few core realities. Mortgage rates are stable but elevated, and the inflationary environment makes meaningful relief unlikely before 2027 at the earliest. The lock-in effect continues to constrain new listings, supporting prices in most markets even as affordability pressures mount. Activity is accelerating across the majority of the region, with 7 of 9 markets posting closings gains and 6 of 9 showing increases in pending sales.
For buyers, the message is nuanced. Waiting for significantly lower rates is a strategy that the macroeconomic data does not currently support. Markets like Anderson County and Roane County offer genuine value relative to the regional average, while Knox County and Farragut remain competitive environments where preparation and speed matter. Sevier County presents a rare buyer’s market with real negotiating leverage.
For sellers, pricing discipline has never been more important. In tight markets like Knox, Farragut, and Blount counties, correctly priced homes are selling in 15 to 18 days. In balanced markets like Lenoir City, the gap between correctly priced and overpriced homes is measured in months, not weeks. And in Sevier County, the market is telling sellers clearly that the days of aspirational pricing are over.
The East Tennessee housing market is not broken, overheated, or collapsing. It is functioning — sometimes efficiently, sometimes unevenly — within the constraints of an inflationary environment, elevated rates, and a structural inventory shortage that shows no signs of resolving soon. Understanding the data at the local level is the single best advantage any buyer or seller can have in this market.