A Market of Contradictions: Why January 2026 Demands a Closer Look
The January 2026 real estate numbers for Knoxville and East Tennessee are in, and if you only glance at the headlines, you’re going to walk away with the wrong story. You’ll see phrases like “prices down” and “homes taking longer to sell” and assume the worst. But when you dig into the data — county by county, metric by metric — the picture is far more nuanced than any single headline can capture. Some corners of this market are surging. Others are correcting. And one major factor — mortgage rates — is reshaping buyer behavior across the entire region in real time.
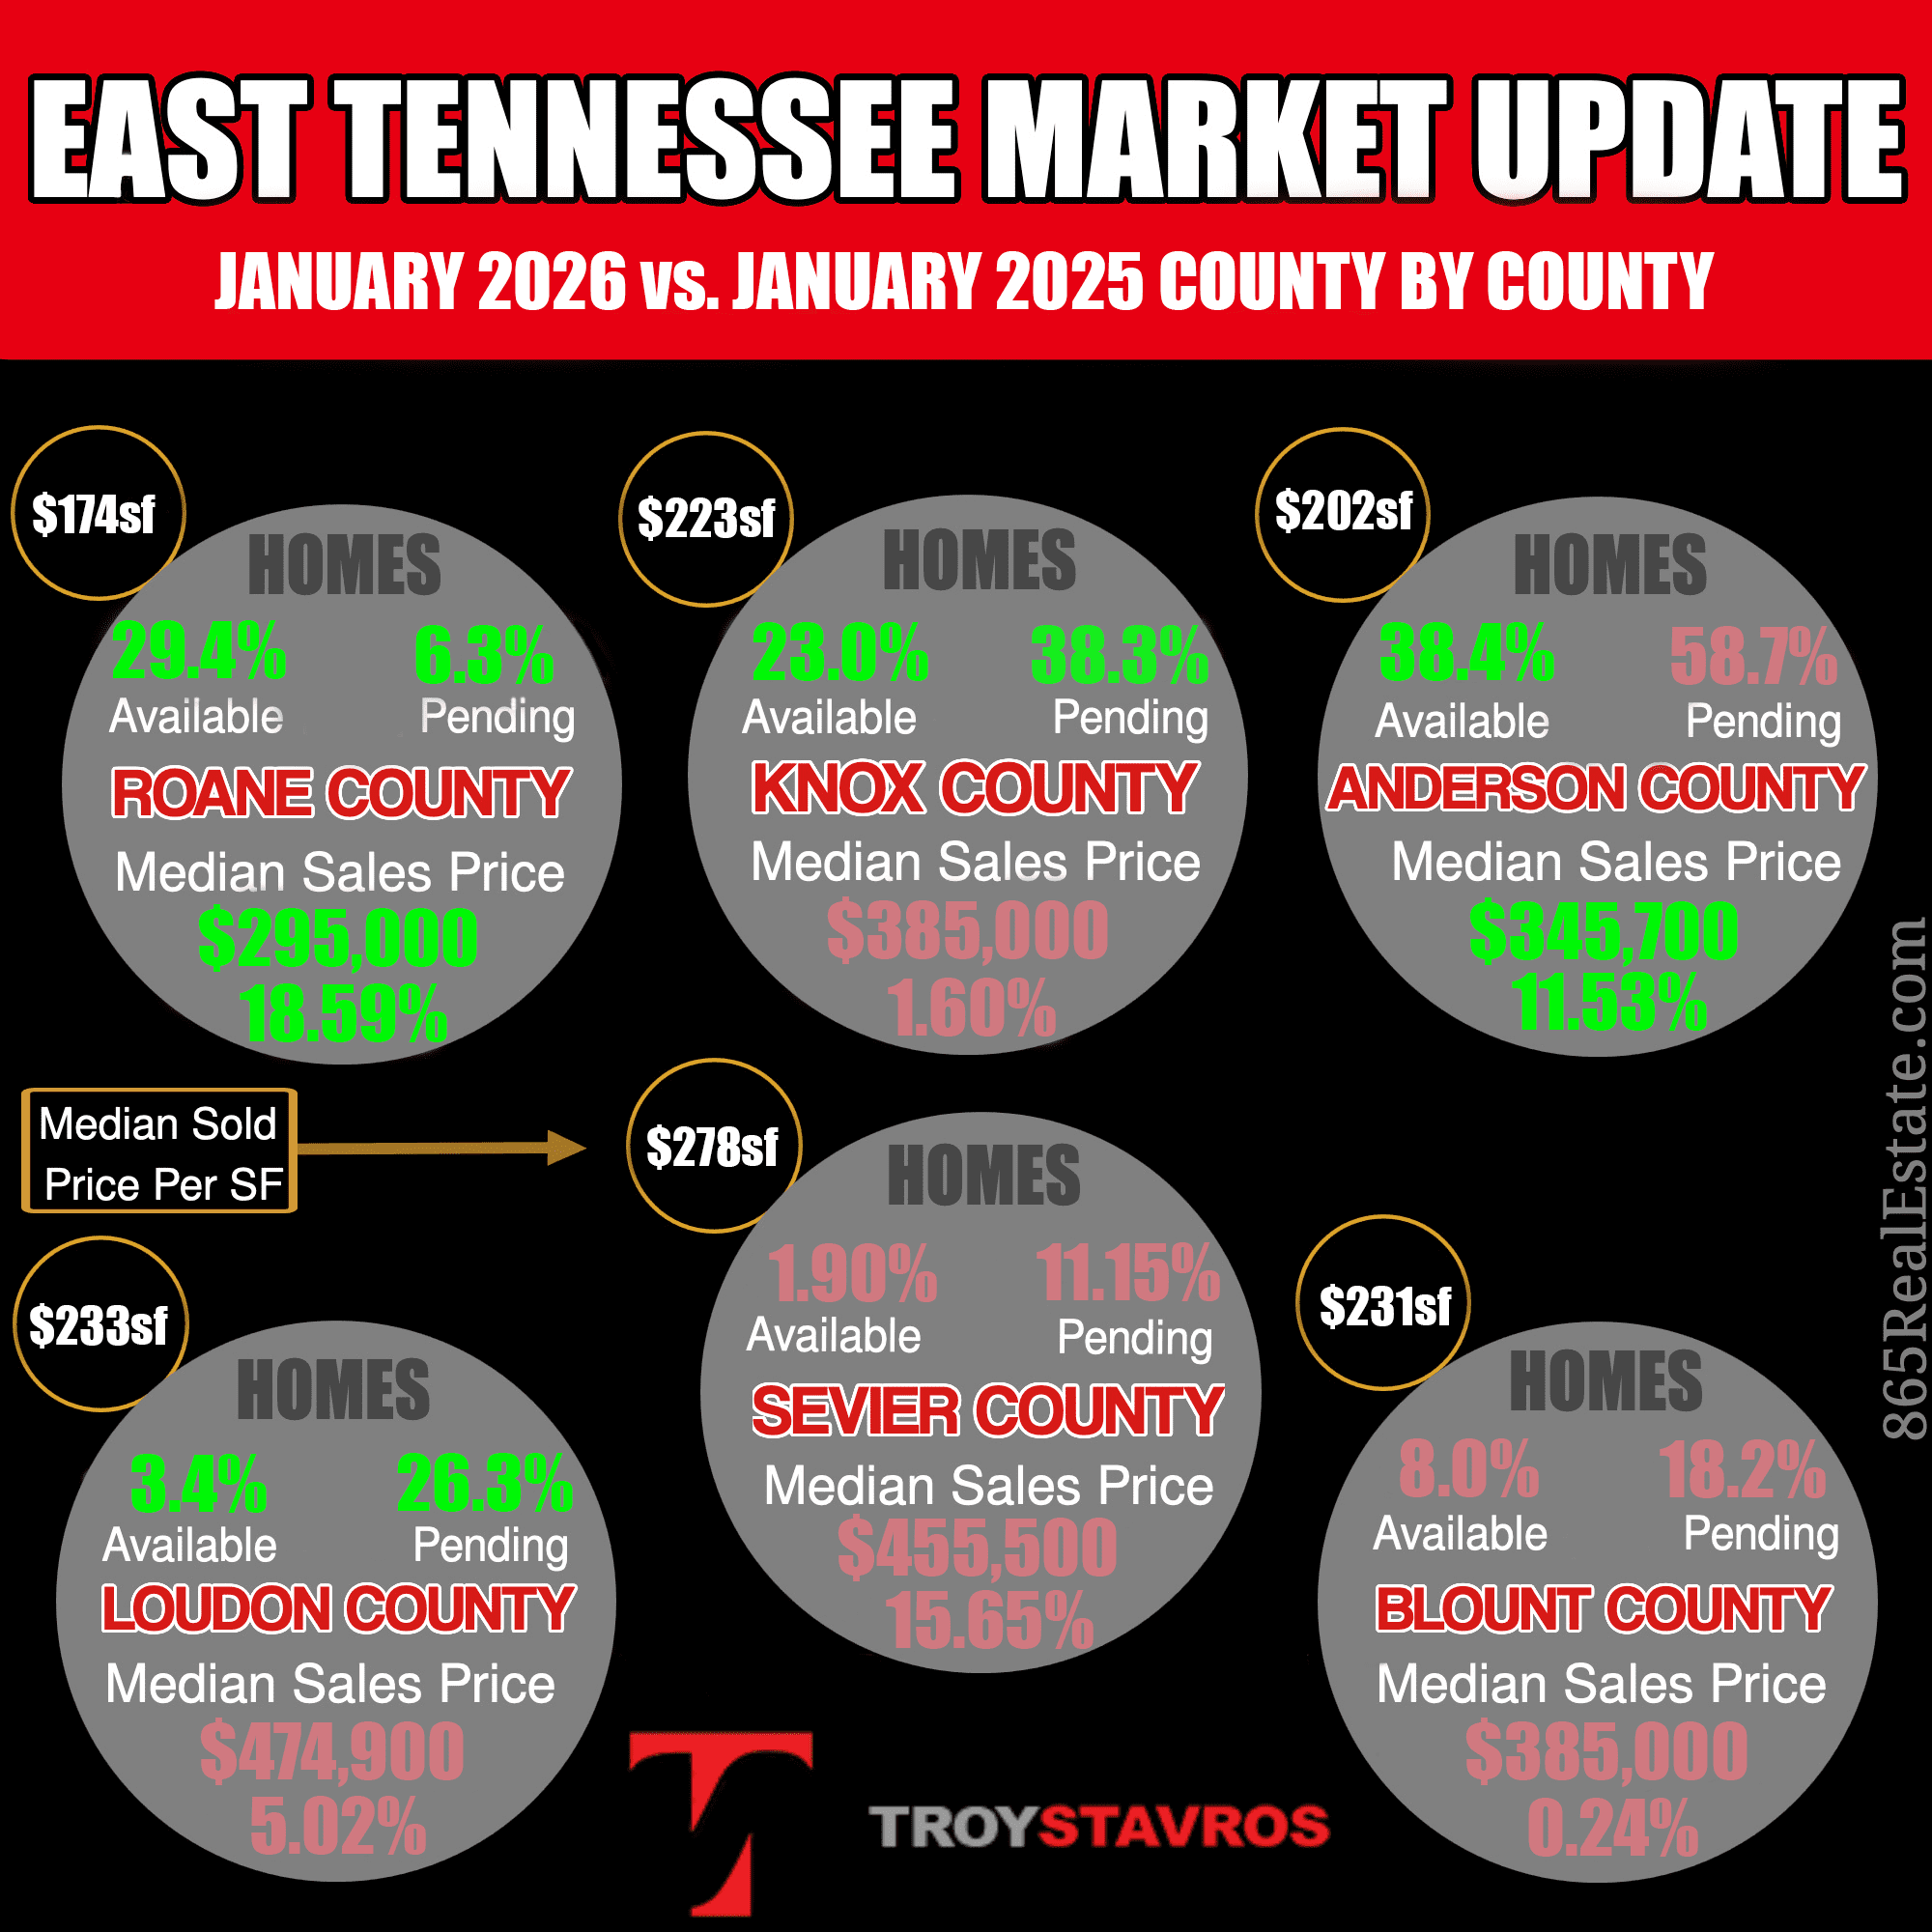
Across the six counties that make up the core of the Knoxville metro and surrounding East Tennessee market — Anderson, Knox, Blount, Loudon, Roane, and Sevier — 900 homes closed in January 2026, representing a 5.3% increase over January 2025. That sounds healthy enough on its own. But that aggregate number is concealing dramatically different realities depending on where you look. The East Tennessee housing market is no longer one market. It’s three. And understanding which one you’re in is the single most important thing you can do before making a buying or selling decision right now.
Why January’s Numbers Require Context
Before diving into the county-by-county breakdown, it’s important to understand that January 2026 was not a normal month for real estate activity. Christmas and New Year’s both fell mid-week this year, which effectively eliminated nearly two full weeks of productive real estate activity. Fewer showings were scheduled, fewer offers were written, and fewer closings made it to the finish line during that stretch.
On top of the holiday disruption, a significant winter storm hit East Tennessee toward the end of January. Inspections were delayed, appraisals were pushed back, and closings that should have happened in late January were postponed into February. So when you look at the closed sale numbers for the month and see modest growth, keep in mind that some of what appears to be softness is really just a timing delay. The real signal — the one that tells you what’s actually happening underneath the surface — is in the pending sales data. And that signal is loud.
Pending Sales Tell the Real Story: Knox County Up 38.3%, East Tennessee Up 24.7%
The single most important number in the entire January 2026 dataset is this: pending home sales in Knox County surged 38.3% compared to January 2025. Across the broader East Tennessee region, pending sales were up 24.7%. These are not small moves. These are seismic shifts in buyer activity.
Pending sales — homes that are under contract but haven’t yet closed — are a leading indicator of where the market is headed. They represent deals that have already been agreed upon and are working their way through inspections, appraisals, and financing. When pending sales surge like this, it means the closed sale numbers over the next 30 to 60 days are going to reflect that wave of activity. In practical terms, the January pending data is telling us that spring 2026 is going to be significantly more active than spring 2025.
The natural question is: why are so many more buyers writing offers right now? And the answer leads directly to the biggest story in the housing market today.
Mortgage Rates Have Dropped to 6% — And It’s Changing Everything
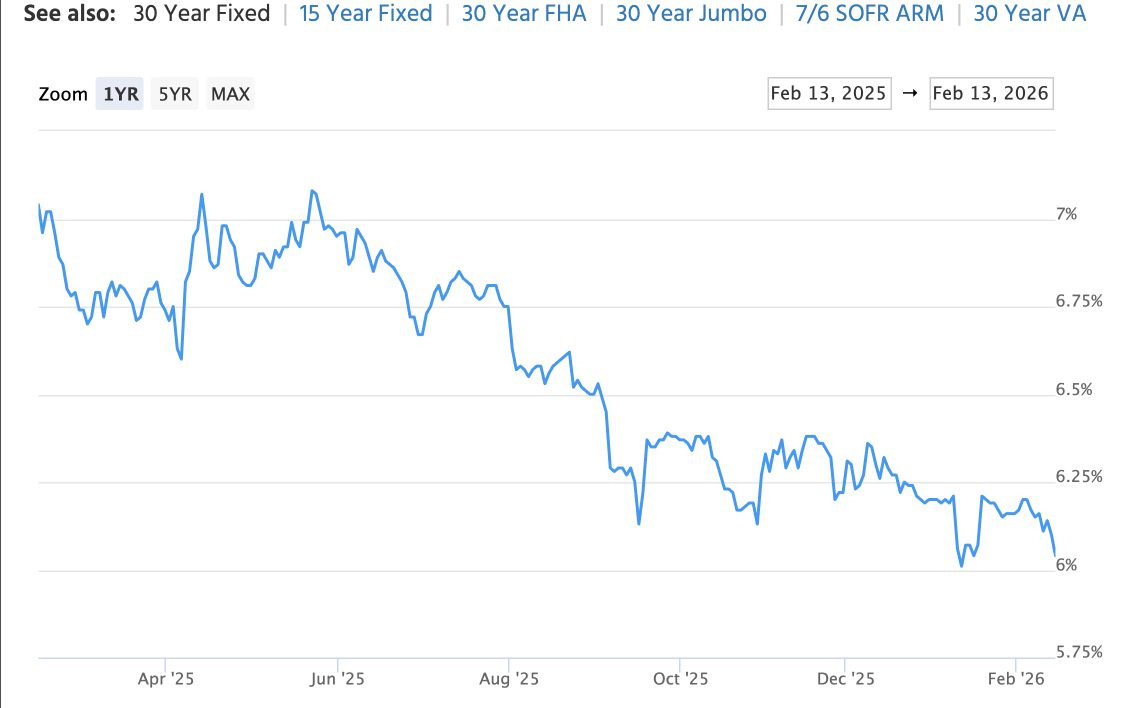
Back in the spring of 2025, the 30-year fixed mortgage rate was hovering between 6.75% and 7%. That kept a significant number of potential buyers on the sidelines. The math simply didn’t work for many households, and the result was a period of suppressed demand that defined much of 2024 and early 2025.
Starting in August 2025, rates began to decline, dipping into the 6.25% range through the fall. Activity picked up, but the real inflection point came in late December when rates broke below 6.25% and continued falling. As of mid-February 2026, the 30-year fixed rate sits at approximately 6%, the lowest level in well over a year.
To understand why this matters, consider a practical example. On a $380,000 home with 10% down, the difference between a 7% rate and a 6% rate translates to roughly $217 per month in savings on the principal and interest payment alone — dropping from approximately $2,276 to $2,059. Over the course of a year, that’s more than $2,600 in savings. That’s enough to bring previously sidelined buyers back into the market. It’s enough to help someone who couldn’t qualify at 7% now get approved at 6%. And the pending sales data strongly suggests that’s exactly what’s happening.
However — and this is the critical insight — the demand unleashed by lower rates is not flowing evenly across the region. It is concentrating heavily in certain counties while bypassing others almost entirely. That divergence is what makes the current market so fascinating and so dangerous to generalize about.
Three Markets in One: Understanding the Tiers
The six-county East Tennessee market has split into three distinct tiers, each with fundamentally different dynamics for buyers and sellers.
The first tier consists of the seller’s markets: Knox County, Blount County, and Anderson County. All three are sitting below three months of supply — Knox at 2.96, Blount at 2.64, and Anderson at 2.6. Homes in these counties are selling in 33 to 52 days, and sellers hold a meaningful advantage. It’s not the frenzied seller’s market of 2021 and 2022, but homes that are priced correctly are selling, and they’re selling with relative efficiency.
The second tier includes the balanced markets: Loudon County and Roane County. Both are sitting between 3.5 and 3.75 months of supply, placing them in that equilibrium zone where neither buyers nor sellers have a decisive advantage. Though as the data will show, the word “balanced” is doing more work in Roane County than it probably should be.
The third tier is the buyer’s market, and it has exactly one member: Sevier County. At 7.35 months of supply — nearly three times the level of Knox, Blount, and Anderson — Sevier is in a category completely by itself. And the trajectory suggests it’s getting worse, not better.
Knox County: The Engine of East Tennessee Real Estate
Knox County recorded 484 closings in January 2026, an 11% increase over January 2025 — the strongest year-over-year growth of any county in the service area by a wide margin. Combined with the 38.3% surge in pending sales, Knox County’s forward momentum heading into spring is unmistakable. The pending-to-active ratio of 40.5% is the highest in the region, meaning that for every ten active listings, roughly four already have buyers under contract.
To put Knox County’s dominance in perspective, it alone accounts for over 40% of all pending sales across the entire East Tennessee market — not just the six counties in this analysis, but the broader region. When people ask how the Knoxville housing market is doing, what they’re really asking, whether they realize it or not, is how Knox County is doing. Knox is the engine, and that engine is responding directly and forcefully to improved mortgage rates.
The one metric worth monitoring in Knox is the 52-day median days on market, which is higher than both Anderson and Blount despite similar absorption rates. This is likely a price-mix issue — Knox has more upper-bracket inventory that naturally takes longer to move — rather than a sign of softening demand. But it’s worth watching as we move into spring.
Blount County: Quietly the Best-Performing Market in the Region
Blount County doesn’t generate the same headlines as Knox, but the data tells a compelling story. The sold-to-original list price ratio in Blount is 95.7% — the highest of any county tracked. The gap between what sellers originally list their homes for and what they ultimately sell for is just 2.2 percentage points, the tightest in the entire dataset.
In plain terms, Blount County sellers are pricing their homes accurately. They’re not overreaching, they’re not testing the market with aspirational prices, and they’re not engaging in the list-high-and-hope strategy that plagues other counties. The result is a market where homes sell in a median of 34 days with the tightest absorption rate in the region at 2.64 months.
There is one apparent blemish in Blount’s data — closings actually declined 4.1% year over year. But in the context of every other demand indicator running strong — tight absorption, fast days on market, solid pending activity — the most logical explanation is not that demand weakened. It’s that there aren’t enough homes available to sell. Blount County’s year-over-year decline in closings is a supply constraint, not a demand problem. And as mortgage rates continue to improve and draw more buyers into the market, that supply constraint is only going to tighten further, with more buyers competing for a limited pool of listings.
Anderson County: Solid Fundamentals, Small Sample Size
Anderson County posted 64 closings in January 2026, up from 60 a year ago — a 6.7% increase. The market mechanics are strong, with 2.6 months of supply and a 33-day median days on market, both among the best in the region. However, context matters here. The difference between this January and last January is four sales. At that volume level, a single subdivision delivering closings can swing the entire year-over-year comparison, so trend data in Anderson should be interpreted with caution given the small sample size.
The metric that stands out in Anderson is the pricing gap. Sellers there are receiving 92.4% of their original asking price, indicating a meaningful disconnect between seller expectations and buyer willingness to pay. That gap is wider than what Knox or Blount are experiencing and suggests that Anderson sellers in particular need to approach their pricing strategy with discipline and honesty. Overpricing in a small-volume market like Anderson carries even more risk than it does in a high-volume market like Knox, because there are fewer buyers to absorb the mistake.
Loudon County: Stability as a Virtue
Loudon County is the least dramatic market in the dataset, and that’s not a criticism. Closings were perfectly flat — 60 in January 2025, 60 in January 2026. Absorption sits at 3.58 months. Median days on market is 42. Every indicator points to a stable, balanced suburban market doing exactly what you’d expect during a period of normalization. There are no red flags, no surprises, and no urgent action items. For buyers and sellers in Loudon County, the message is straightforward: the market is functioning normally, and standard real estate fundamentals apply.
Roane County: Why “Balanced” Is Misleading
On the surface, Roane County’s 3.68 months of supply places it squarely in balanced territory. But the underlying metrics tell a less reassuring story.
Roane County has the worst sold-to-original list price ratio of any county in the dataset at 91.5% — worse even than Sevier County, which has more than double the supply. Sellers in Roane are overpricing more aggressively than sellers in a market with seven-plus months of inventory, and the consequences are visible in the data. The gap between original list price and final sale price is 4.6 percentage points, the widest in the region, meaning sellers are listing high, cutting their price, and then negotiating down further at the offer stage.
Compounding the pricing issue, the pending-to-active ratio in Roane is just 25.8%, nearly tied with Sevier County for the weakest forward demand signal in the data. This is particularly concerning because even with mortgage rates improving significantly, Roane is not experiencing the same demand response that Knox and Blount are seeing. Lower rates are a rising tide, but some markets have structural issues that a rising tide alone cannot fix.
Roane County is the market that most concerns me heading into the second quarter of 2026. If spring brings a wave of new listings without a proportional increase in buyer activity, that 3.68 months of supply could climb quickly, tipping Roane from balanced territory into something less favorable. Sellers in Roane need to hear this reality and price accordingly.
Sevier County: The Correction Isn’t Over
There is no way to sugarcoat what’s happening in Sevier County. The data points to a market correction that still has further to go.
The headline numbers are stark. Sevier County has 1,552 active listings and recorded just 116 closings in January 2026, a 4.1% decline from a year ago. The absorption rate of 7.35 months places it firmly in buyer’s market territory. The median days on market is 99, meaning the typical Sevier County seller waits more than three months to reach the closing table. And for every seven listings on the market, only one has a buyer under contract — a pending-to-active ratio of just 14.9%, by far the lowest in the region.
But the most revealing number is this: pending sales in Sevier County declined 11.15% year over year. Not increased. Declined. The buyer pipeline is actively shrinking.
Consider what that means in context. Mortgage rates have dropped from nearly 7% to approximately 6%. Pending sales across East Tennessee are up nearly 25%. Knox County pending sales are up over 38%. And Sevier County — despite benefiting from the same rate environment — saw its pending activity drop by double digits. This tells us something critically important: the rate improvement that is pulling buyers off the sidelines everywhere else is not sufficient to address what’s happening in Sevier. The problem in Sevier County is not the cost of borrowing. The problem is structural oversupply and persistent overpricing, and lower mortgage rates alone are not going to solve it.
The origins of Sevier County’s predicament are well understood. The county was ground zero for the short-term rental investment boom from 2020 through 2023, fueled by proximity to the Great Smoky Mountains and Gatlinburg. Investors poured in, property values surged, and the market absorbed an enormous amount of speculative inventory. Now those properties are hitting the resale market, and there simply aren’t enough buyers to absorb them at the prices sellers need. Sevier County currently carries nearly as much active inventory as Knox County, despite Knox having four to five times the population. That is a structural imbalance that will not resolve itself quickly.
Prices in Sevier County are going to need to come down further. Sellers who resist that reality will watch their days on market stretch well beyond the already elevated 99-day median. With pending activity declining by double digits year over year — in a falling rate environment — the data does not support the conclusion that Sevier County has reached its bottom.
What This Means for Sellers in the Knoxville and East Tennessee Market
Pricing discipline is the single most important factor determining seller outcomes in early 2026. Across the six counties analyzed, the gap between the best and worst sold-to-original list price ratios is 4.2 percentage points. On a $400,000 home, that gap represents roughly $17,000. The counties where sellers are pricing accurately — Blount and Knox — are the counties where homes are selling fastest and where sellers are retaining the highest percentage of their asking price.
Overpricing does not lead to a higher sale price. It leads to extended days on market, a visible price reduction that weakens negotiating leverage, and ultimately a lower final sale price than would have been achieved with correct pricing from the start. The improving rate environment means more buyers are entering the market, but that does not give sellers license to list above market value and hope that demand catches up. It doesn’t work that way. Price it right from day one, in every county, at every price point.
What This Means for Buyers in the Knoxville and East Tennessee Market
For buyers, the strategy depends entirely on geography. In Knox County and Blount County, supply is tight, demand is surging, and competitive offers are going to be necessary. A market with sub-three-month supply and pending sales growth exceeding 38% is not a market where lowball offers are likely to succeed. Buyers in these counties need to be prepared, pre-approved, and realistic about pricing.
In Sevier County, the dynamic is completely different. Seven-plus months of supply, double-digit declines in pending activity, and sellers already accepting 91.6% of original asking prices means there is meaningful negotiating room that simply does not exist elsewhere in the region. For buyers with a long-term investment horizon and the patience to weather a market that may still be correcting, Sevier County offers opportunities that are unique in East Tennessee right now.
The rate environment adds an important dimension for buyers across all markets. The drop from 7% to approximately 6% translates to over $200 per month in savings on a typical East Tennessee purchase. Many buyers who were priced out or chose to wait during the higher-rate environment of 2024 and early 2025 now find themselves in a meaningfully stronger position. The combination of improved rates and — in select markets — increased inventory and greater negotiating leverage makes early 2026 the most favorable buying environment this region has seen in over a year.
Spring 2026 Forecast: What Comes Next
The pending sales data makes one thing clear: the buyer paralysis that defined much of the past 18 months is breaking. Buyers are returning to the market in significant numbers, driven primarily by the improvement in mortgage rates.
In the seller’s market counties — Knox, Blount, and Anderson — the spring trajectory will depend on whether new listings keep pace with demand. If inventory grows alongside buyer activity, these markets stay in healthy, corrective-mode territory where both sides have reasonable leverage. If demand outpaces new supply, which the pending data suggests is very possible, prices stabilize and potentially begin firming up.
In Sevier County, spring presents a different test entirely. Listing season will bring additional inventory into a market that already cannot absorb what it has. With pending sales declining and no sign of the demand surge that’s lifting other counties, the correction in Sevier has room to run.
The East Tennessee real estate market is not broken. It is a market finding its footing after an extraordinary few years of pandemic-era disruption, investment speculation, and rate volatility. For those who understand the data — who recognize that a listing strategy in Blount County requires a fundamentally different approach than one in Roane or Sevier County — there are real opportunities across this region right now.
The key is knowing which market you’re actually in.
Have questions about buying or selling in the Knoxville and East Tennessee market? Every county and every price point is different right now. Reach out to discuss what the data means for your specific situation.