865 Real Estate

East Tennessee Real Estate & Neighborhood Source

  • Home
  • Search Property
    • Search East Tennessee Lots & Land for sale
    • East Tennessee Homes for Sale with Acreage (5+ acres)
    • East Tennessee Land for Sale with Acreage (5+ Acres)
    • Search Homes For Sale by Zip Code
    • SEARCH Homes for Sale In Farragut TN
      • Condos for sale in Farragut
      • 5 Bedroom Homes For Sale in Farragut TN
    • Homes Recently Sold in Farragut, TN
    • New Homes for Sale in Knoxville, TN
    • Waterfront Properties in the Knoxville, TN Area
    • Lakefront Land For Sale in the Knoxville, TN area
    • Waterfront Condos for sale in the Knoxville, TN Area
  • Buy
    • Welcome Knoxville Home Buyers
    • Pre-Approval
    • Buyer Representation
    • Why use a REALTOR?
    • VIDEO: Learn The Home Buying Process
    • Real Estate Glossary
  • Sell
    • What Is My Home Worth?
    • The Selling Process – Selling a Home in Knoxville
    • Choosing an Agent
    • Why use a REALTOR?
  • BLOG
    • Home Selling
    • Home Buying
    • Home Market News
    • Featured Property
    • Home Owner Advice
    • Things To Do in Knoxville
  • Our Team
  • Contact
  • Email
  • Facebook
  • Instagram
  • LinkedIn
  • Phone
  • Twitter
  • YouTube

Knoxville and Farragut TN Real Estate Market Snapshot – February

March 14, 2015 By Troy Stavros

Here are the most recent (February) statistics for the Knoxville and Farragut TN real estate markets.
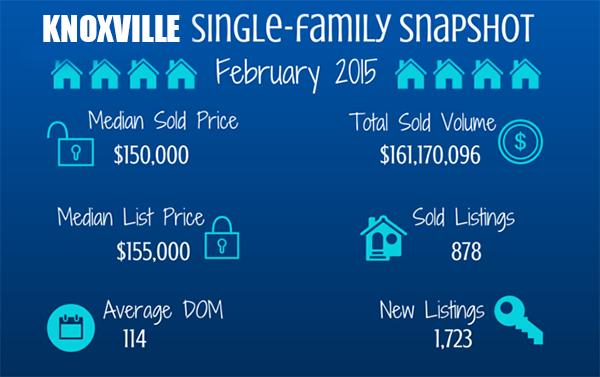
Knoxville real estate market snapshot February

Here is a quick Knoxville TN real estate market snapshot for February.  The highlighted stats are:

  • Median sold price = $150,000
  • Median list price = $155,000
  • Average days on the Market = 114 days
  • Sold Listings = 878
  • New Listings = 1723
  • Absorption Rate = 8.65 months
  • Homes sales are up 5.3% compared to last year.
  • Home prices are up 13.08% compared to last year.

Here are the Farragut TN real estate market stats for February:

  • Median sold price = $315,750
  • Median list price = $409,900
  • Average days on the market = 107 days
  • Sold listings = 26
  • New Listings = 46
  • Absorption Rate = 4.23 months
  • Year to Date home sales are up 25% compared to last year.
  • Year to Date home prices are up 5.97% compared to last year.

Have questions about the market or anything Knoxville or Farragut real estate related?  Contact me, Troy Stavros with Gables & Gates, REALTORS and I’d be happy to answer any questions you have!


Filed Under: Blog, Home Market News Tagged With: Farragut home prices, farragut real estate market, Knoxville home prices, Knoxville real estate market

CALL or TEXT 865-999-0925

  • Email
  • Facebook
  • Instagram
  • LinkedIn
  • Phone
  • Twitter
  • YouTube
Search Knoxville Real Estate

RECENT BLOG POSTS

  • East Tennessee Housing Market Report (October 2026 | Data Through September 2026)
  • East Tennessee Housing Market Report — September 2026 | August Data Analysis
  • East Tennessee Housing Market Report — July 2026 Data | August Update
  • 1.09 Acres at 1751 Old Hillsboro Road: A Rare Franklin, TN Property Offering Country Charm, City Convenience & Serious Investment Potential
  • 835 N 4th Avenue: Urban Charm Meets High-Yield Potential in Knoxville’s Historic 4th & Gill

CALL / TEXT ME @ 865-999-0925

  • Email
  • Facebook
  • LinkedIn
  • Twitter
  • YouTube
  • Privacy Policy

Copyright 2026 - Troy Stavros - CornerStone Realty Associates, LLC - 865-966-9700 - 12760 Kingston Pike Suite 101, Knoxville, TN 37934 *Some or all of the listings displayed on this site may not belong to CornerStone Realty Associates, LLC. IDX information is provided exclusively for consumers’ personal, non-commercial use, and may not be used for any purpose other than to identify prospective properties consumers may be interested in purchasing. All data is deemed reliable, but is not guaranteed.