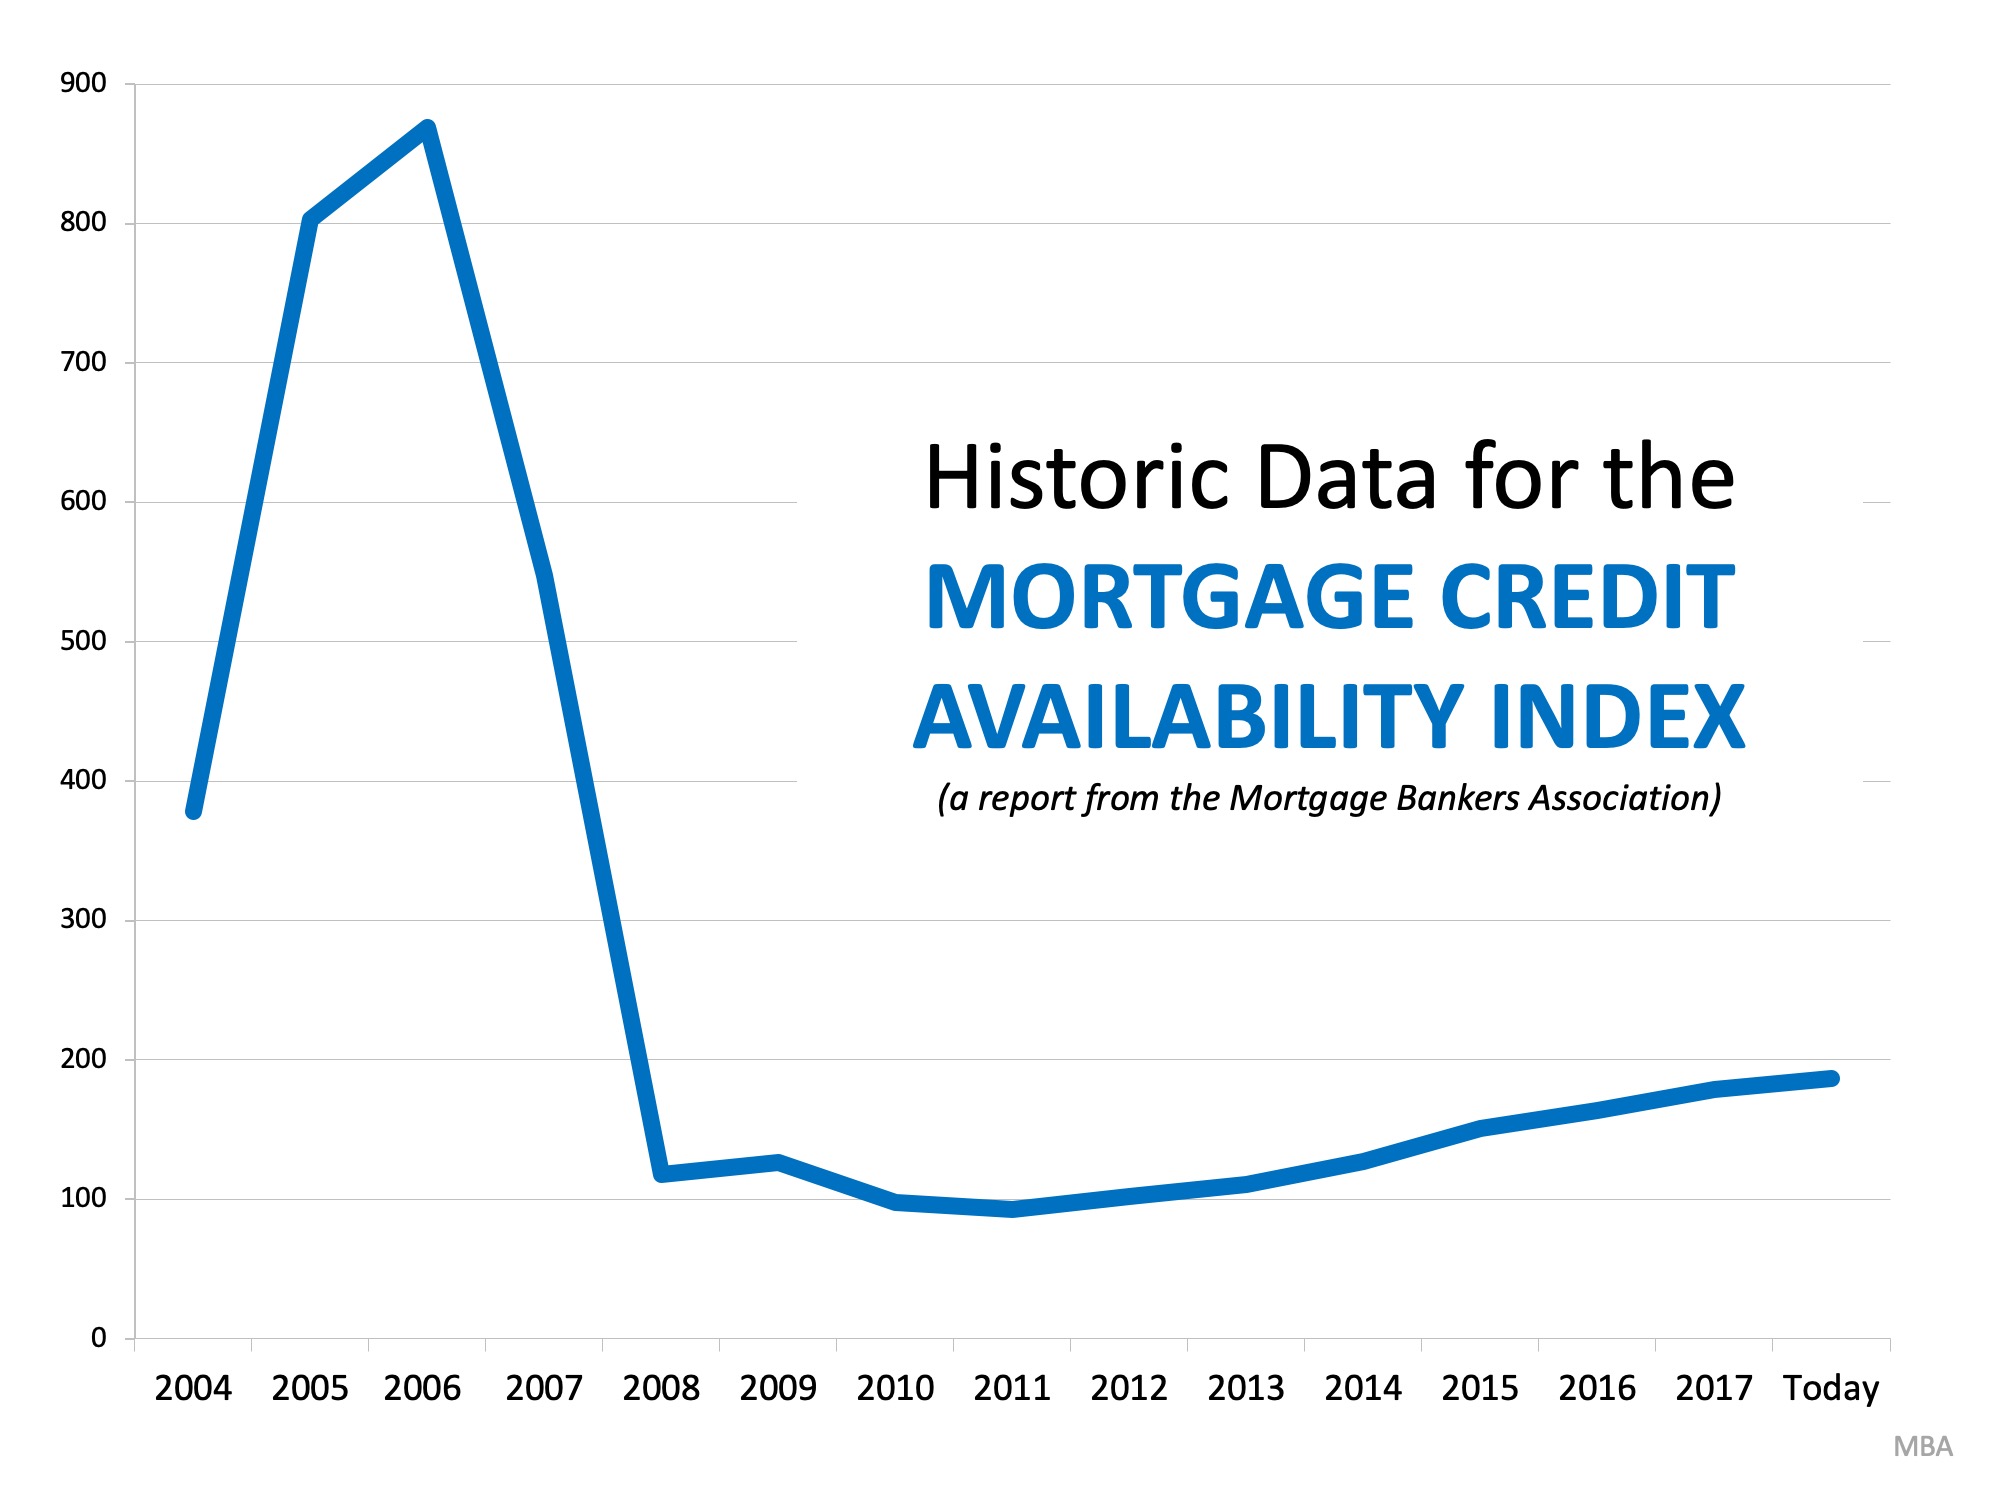
2008 vs. Now: Are Owners Using Their Home Equity as ATMs Again?

Over the last six years, we have experienced strong price appreciation which has increased home equity levels dramatically. As the number of “cash-out” refinances begins to approach numbers last seen during the crash, some are afraid that we may be repeating last decade’s mistake.

However, a closer look at the numbers shows that homeowners are being much more responsible with their home equity this time around.

What happened then…

When real estate values began to surge last decade, people started using their homes as personal ATMs. Homeowners would refinance their houses and convert their equity into instant cash (known as “cash-out” refinances). Because homes were appreciating so rapidly, many homeowners tapped into their equity multiple times.

This left homeowners with little-or-no equity left in their homes, so when prices started to fall many homeowners found their houses in a negative equity situation (where the mortgage amount was greater than the value of the home). When some of these homeowners saw that there was no value left in their houses, they just stopped paying their mortgages altogether.

Banks eventually foreclosed on those homes and the foreclosures drove prices down even further and put more homes in the negative equity category. This cycle continued, leading to the worst housing crash in almost one hundred years.

What’s happening now…

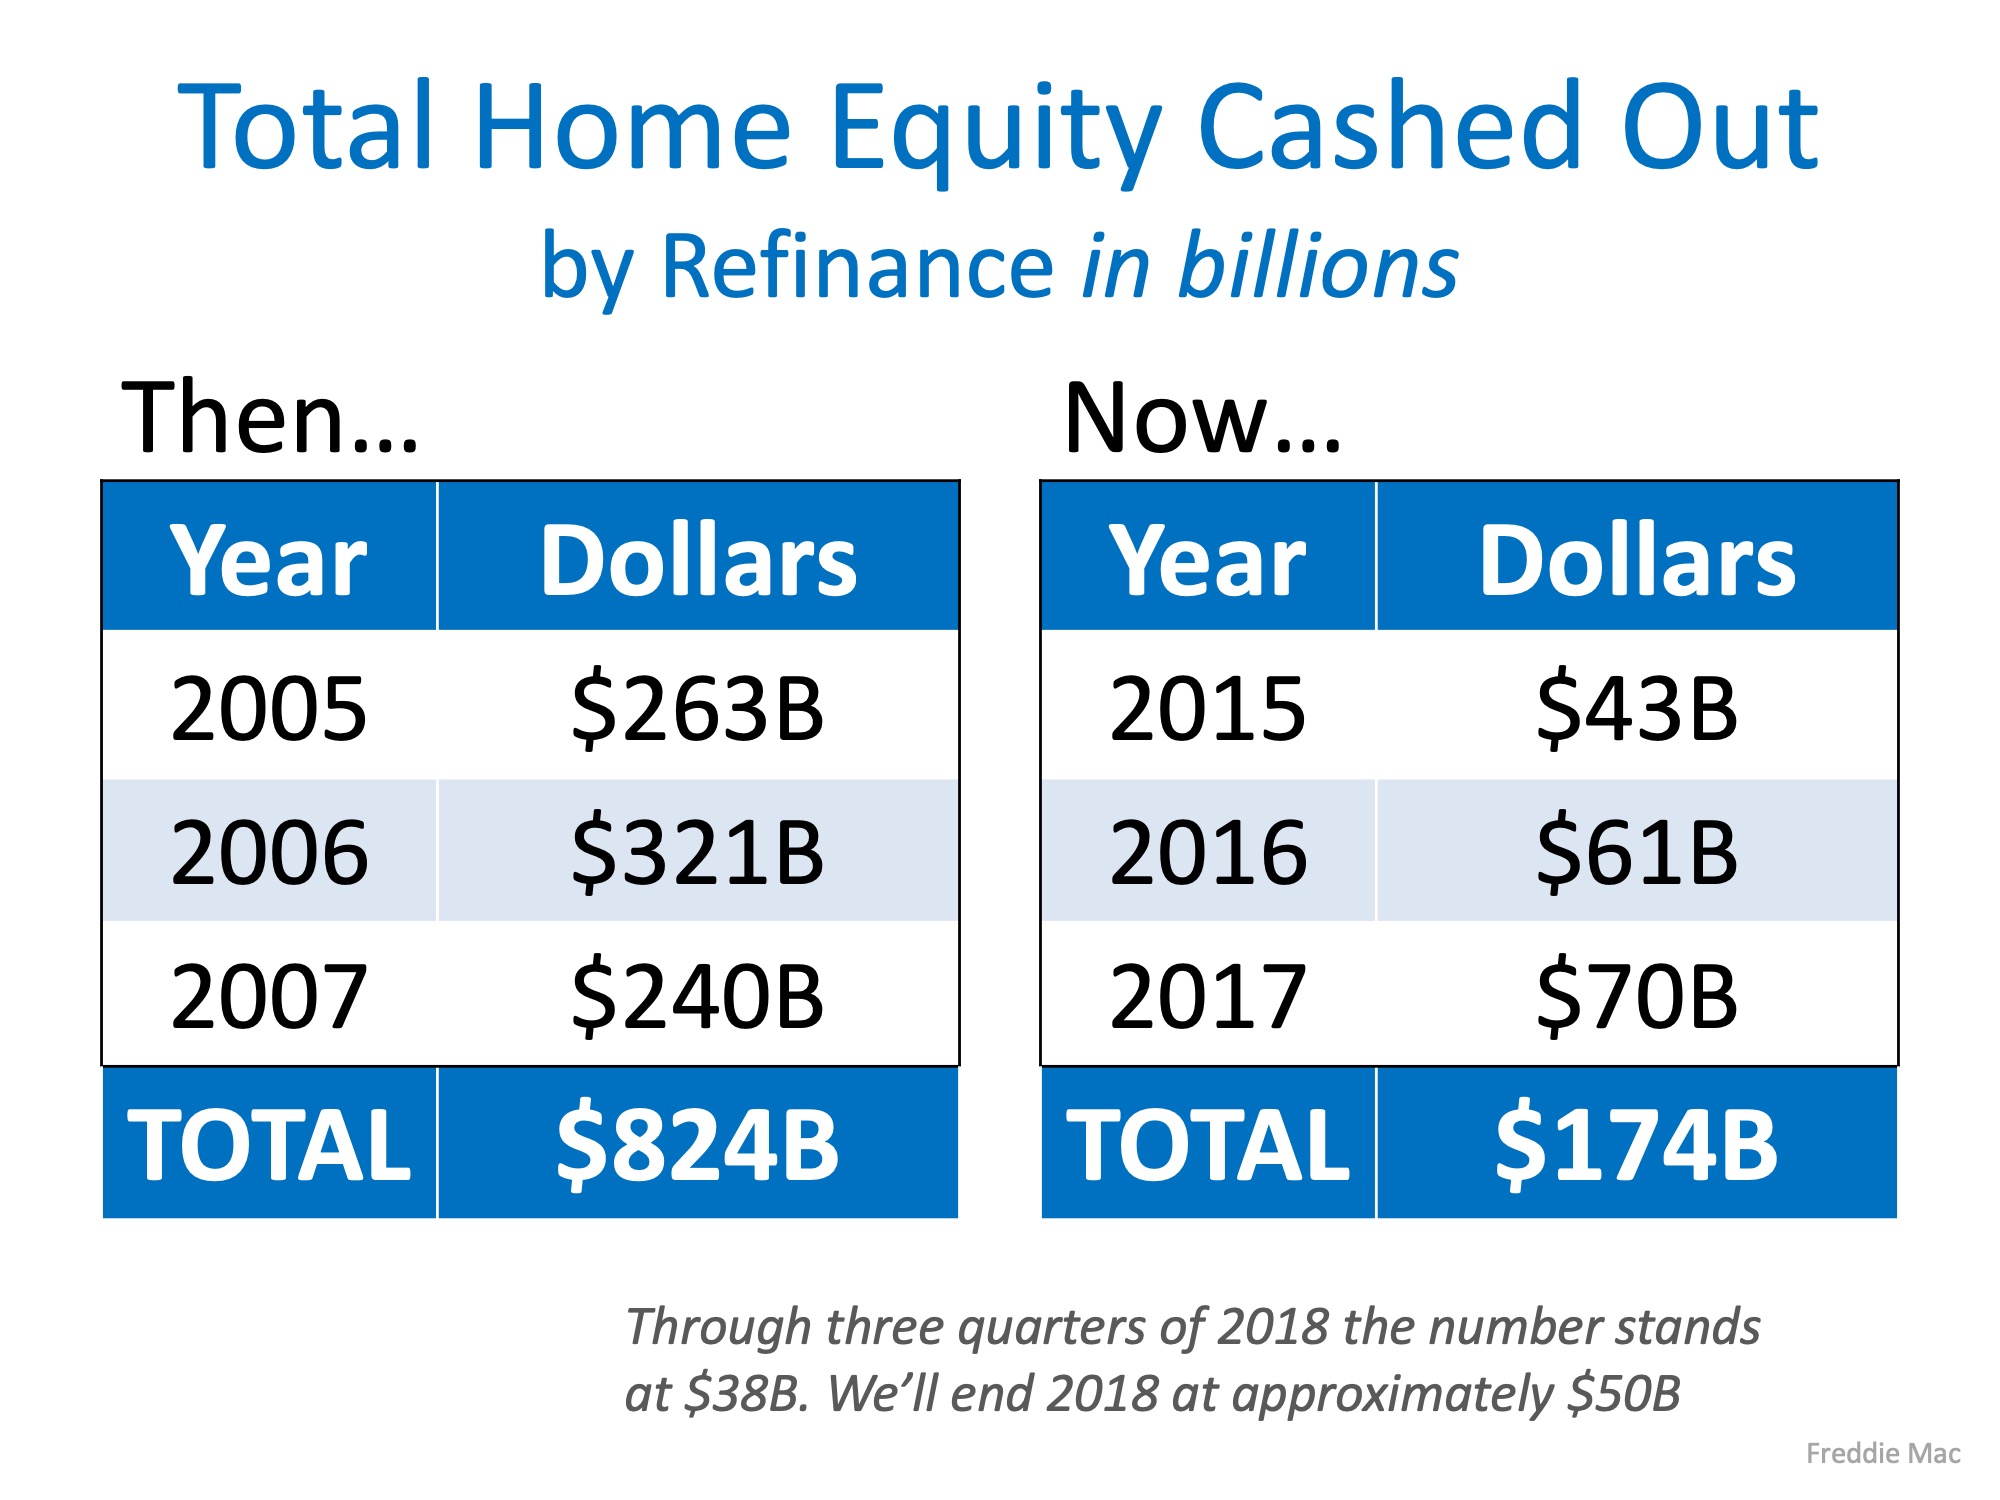
Again, Americans are seeing their home equity grow. Today, over 48% of all single-family homes in the country have over 50% equity, and yes, some families are tapping into that equity. However, this time around, homeowners are not making irresponsible decisions. According to the latest information from Freddie Mac, the total equity being “cashed out” is a fraction of what it was leading up to the crash. Here are the numbers:

2008 vs. Now: Are Owners Using Their Homes as ATMs Again? | MyKCM

Bottom Line

The recklessness that accompanied the build-up in equity prior to the last crash does not exist today. That makes this housing market much more secure than the one we had heading into 2008.

Further Proof It’s NOT 2008 All Over Again

Home sales numbers are leveling off, the rate of price appreciation has slowed to more historically normal averages, and inventory is finally increasing. We are headed into a more normal housing market.

However, some are seeing these adjustments as red flags and are suggesting that we are headed back to the same challenges we experienced in 2008. Today, let’s look at one set of statistics that prove the current market is nothing like the one that preceded the housing crash last decade.

The previous bubble was partially caused by unhealthy levels of mortgage debt. New purchasers were putting down the minimum down payment, resulting in them having little if any equity in their homes.

Existing homeowners were using their homes as ATMs by refinancing and swapping their equity for cash. When prices started to fall, many homeowners found themselves in a negative equity situation (where their mortgage was higher than the value of their home) so they walked away which caused prices to fall even further. When this happened, even more homeowners found themselves in negative equity situations which caused them to walk away as well, and so a vicious cycle formed.

Today, the equity situation is totally different. According to a new report from ATTOM Data Solutionsmore than 1-in-4 homes with a mortgage have at least 50% equity. The report explains:

“…nearly 14.5 million U.S. properties were equity rich — where the combined estimated amount of loans secured by the property was 50 percent or less of the property’s estimated market value…The 14.5 million equity rich properties in Q3 2018 represented 25.7 percent of all properties with a mortgage.”

In addition, according to the U.S. Census Bureau, 30.3% of homes in the country have no mortgageon them.

Further Proof It’s NOT 2008 All Over Again | Simplifying The Market

Almost 50% of all homes have at least 50% equity.

If we take both numbers, the 30.3% of all homes without a mortgage and the 17.9% with at least 50% equity (25.7% of the 69.3% of homes with a mortgage), we realize that 48.2% of all homes in the country have at least 50% equity.

Bottom Line

Unlike 2008, almost half of the homeowners in the country are sitting on massive amounts of home equity. They will not be walking away from their homes if the housing market begins to soften.

Wage Increases Make Home Buying More Affordable

Everyone knows that housing affordability has been negatively impacted by rising prices and increasing mortgage rates, but there is another piece to the affordability equation – wages.

How much a family earns obviously impacts how easy or difficult it is for them to afford to own a home. Because of an improving economy, wages are finally beginning to increase – and that dramatically affects home affordability.

According to the National Association of Realtors’ (NAR) September 2018 Housing Affordability Index,wages have increased in every region of the country:

Wage Increases Make Home Buying More Affordable | Simplifying The Market

After applying current salaries, home prices, and mortgage rates to their Home Affordability Index equation, the index, though still lower than this time last year (160.1 to 146.7), increased over the last month (141.2 to 146.7). For the complete methodology used by NAR, click here.

The percentage of income needed to own a home has also decreased each of the last three months. It currently sits at 17% which is substantially lower than historic numbers.

Wage Increases Make Home Buying More Affordable | Simplifying The Market

Bottom Line

If you are a first-time buyer or a move-up buyer who believes that purchasing a home is not within your budget, let’s get together to determine if that is still true.

Are Homeowners Renovating to Sell or to Stay?

Over the past few years, two trends have emerged in the housing market:

  1. Home renovations have shot up
  2. Inventory of homes available for sale on the market has dropped

A ‘normal’ housing market is defined by having a 6-month supply of homes for sale. According to the latest Existing Home Sales Report from the National Association of Realtors, we are currently at a 4.4-month supply.

This low inventory environment has many current homeowners worried that they would be unable to find a home to buy if they were to list and sell their current houses, which is causing many homeowners to instead renovate their homes in an attempt to fit their needs.

According to Home Advisorhomeowners spent an average of $6,649 on home improvements over the last 12 months. If that number seems high, it also includes homeowners who recently bought fixer-uppers.

A new study from Zillow asked the question,

“Given a choice between spending a fixed amount of money on a down payment for a new home or fixing up their current home, what would you do?”

Seventy-six percent of those surveyed said that they would rather renovate their current homes than move. The results are broken down by generation below.

Are Homeowners Renovating to Sell or to Stay? | Simplifying The Market

More and more studies are coming out about the intention that many Americans have to ‘age in place’ (or retire in the area in which they live). Among retirees, 91% would prefer to renovate than spend their available funds on a down payment on a new home.

If their current house fits their needs as far as space and accessibility are concerned, then a renovation could make sense. But if renovations will end up changing the identity of the home and impacting resale value, then the renovations may end up costing them more in the long run.

With home prices increasing steadily for the last 6.5 years, homeowners have naturally gained equity that they may not even be aware of. Listing your house for sale in this low-competition environment could net you more money than your renovations otherwise would.

Bottom Line

If you are one of the many homeowners who is thinking about remodeling instead of selling, let’s get together to help you make the right decision for you based on the demand for your house in today’s market.

Why Has Housing Supply Increased as Sales Have Slowed Down?

According to the latest Existing Home Sales Report from the National Association of Realtors (NAR), the inventory of homes for sale this year compared to last year has increased for the last four months, all while sales of existing homes have slowed compared to last year’s numbers.

For over three years leading up to this point, the exact opposite was true; Inventory dropped as sales soared.

NAR’s Chief Economist Lawrence Yun shed some light on what could be contributing to this shift,

“This is the lowest existing home sales level since November 2015. A decade’s high mortgage rates are preventing consumers from making quick decisions on home purchases. All the while, affordable home listings remain low, continuing to spur underperforming sales activity across the country.”

Let’s take a deeper look:

Interest Rates

Since January, 30-year fixed mortgage interest rates have increased nearly a full percentage point (from 3.95% to 4.9%). Fannie Mae, Freddie Mac, the National Association of Realtors, and the Mortgage Bankers Association are all in agreement that rates will continue to increase to about 5.2% over the next 12 months.

“The rise in [mortgage] rates paired with this very strong price appreciation absolutely is slowing housing,” said Fannie Mae’s Chief Economist Doug Duncan.

Even though rates are higher than they’ve been in a decade, they still remain below the average for the 1970s, 80s, 90s, and 2000s!

Mismatch of Inventory

Elizabeth Mendenhall, President of NAR, said it best, “Despite small month over month increases, the share of first-time buyers in the market continues to underwhelm because there are simply not enough listings in their price range.”

Prices of starter and trade-up homes have appreciated faster than their higher-priced counterparts. Over the last 5 years, the lowest-priced homes have appreciated by 47% while the highest-priced homes have appreciated by only 24%.

According to the Institute of Luxury Home Market’s Luxury Market Report, the $1M-and-up price range is now experiencing a buyer’s market. This means that supply (inventory) has finally caught up with demand and buyers are in the driver’s seat when it comes to negotiations. Additionally, many listings in this price range have experienced price cuts in order to entice buyers to put in offers.

Natural Disasters

Although not fully to blame for the national shortage in sales and inventory, natural disasters like Hurricane Florence, Hurricane Michael, and the wildfires on the West Coast have certainly had an impact.

Bottom Line

Additional inventory coming to market could help normalize the housing market and allow incomes to catch up to home prices. For more information about sales and inventory in our area, let’s get together so we can help you make the best decision for you and your family.