NATIONAL HOME PRICES:
- June 2014 to July 2014 – DOWN 3.1%
- July 2013 to July 2014 – DOWN 6.8%
KNOXVILLE HOME PRICES:
- June 2014 to July 2014 – UP 4.6%
- July 2013 to July 2014 – UP 7.8%
With school starting back up, we can expect an increase in average days on the market. This is already being witnessed as average days on the market in Knoxville went from 96 days in June to 102 days in July, but this is still much better than July of 2013 when average days on the market in Knoxville was 193 days.
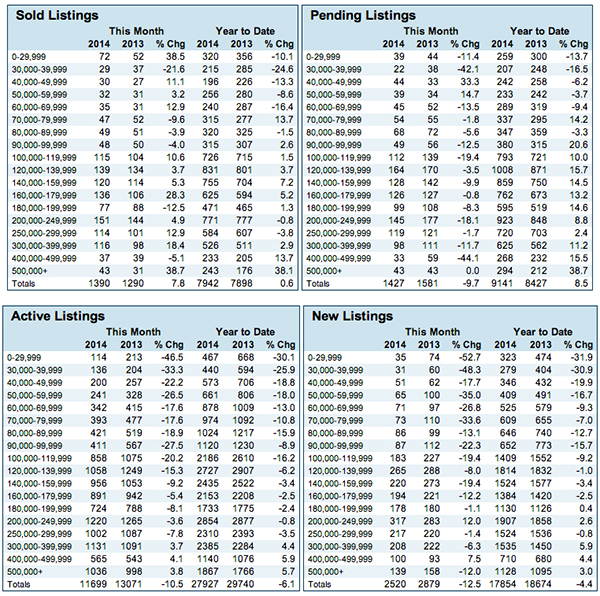
One of the main reasons for the rising prices and reduced days on the market for Knoxville real estate is lower inventory levels. Here are some comparisons to give you a picture of the inventory of Knoxville homes for sale:
KNOXVILLE REAL ESTATE INVENTORY LEVELS
July 2013 to July 2014 – DOWN 10.5%
YTD 2013 to YTD 2014 – DOWN 6.1%
Some of the statistics vary widely depending on what price range you are in when selling or buying Knoxville real estate. This chart will break it down (don’t hesitate to contact me with any questions you have about the numbers above or in the chart below).
Now the big question is what does this information mean for you as someone looking to sell your home in Knoxville or buy a home in Knoxville? As a seller, low inventory levels mean that this is a great time to put your home on the market, as there is less competition. As a buyer, buying a home in a low inventory home market means, you need to be less aggressive with your offers as there is increased competition in the marketplace. Making low offers or hesitating too long in deciding to make an offer will most likely cause you to lose out on desirable homes, as they will be snapped up by competing buyers.
Thinking about selling and wondering how much your Knoxville home might be worth? CLICK HERE for an instant estimate.
For more information or to discuss your personal goals in selling or buying a home in Knoxville, contact me, Troy Stavros with Gables & Gates, REALTORS today.
