“…fell 10.5 percent to a seasonally adjusted annual rate of 4.76 million in November (lowest since April 2014 at 4.75 million)…”
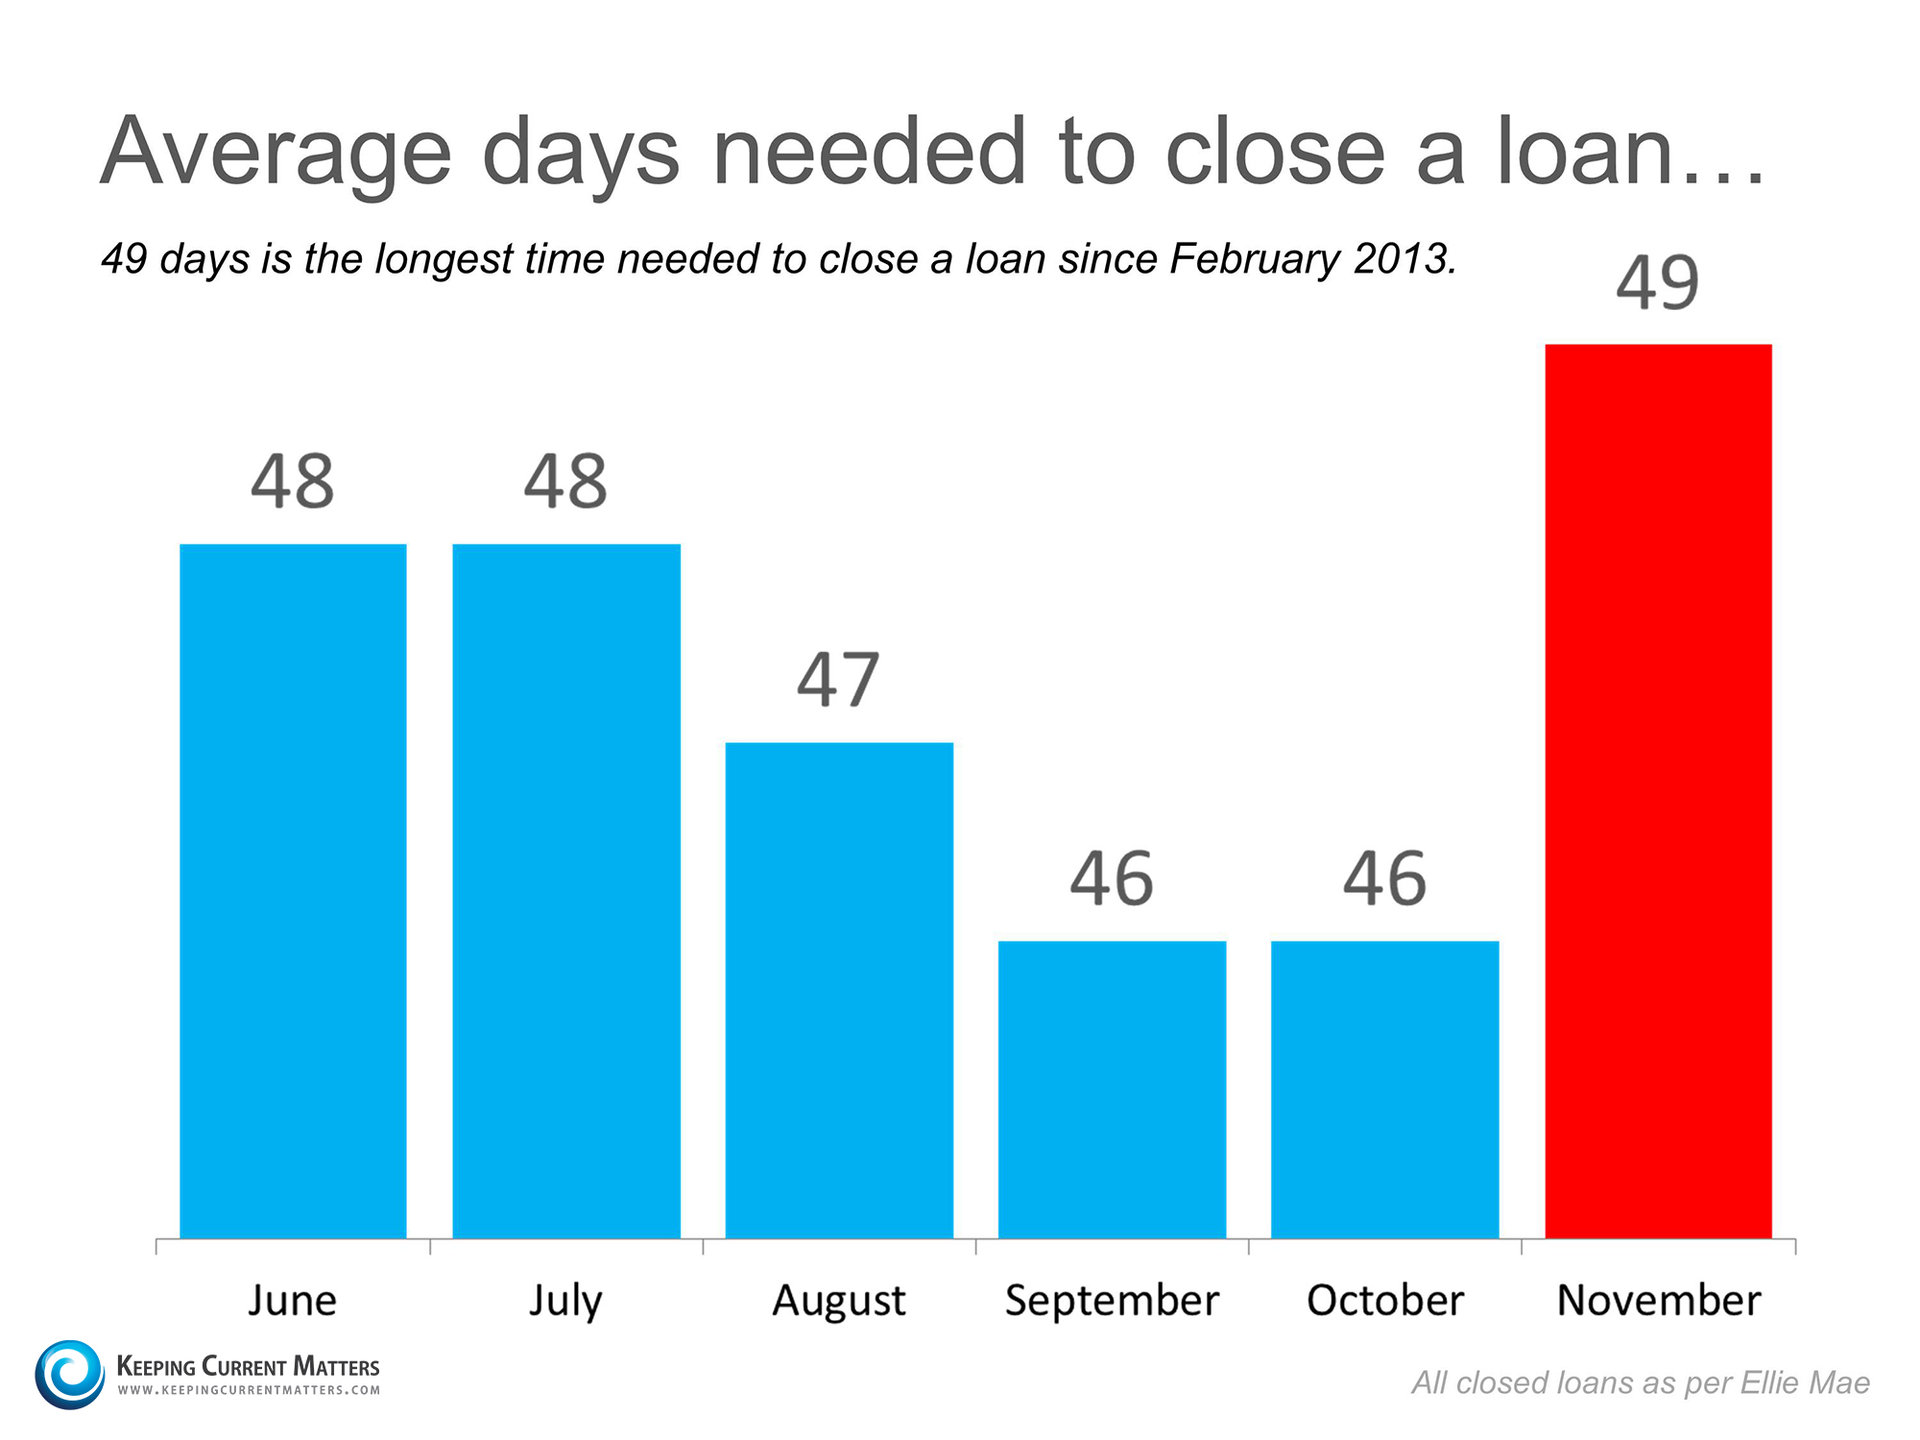
That report gave birth to a series of industry articles, some questioning whether the housing market was slowing. The truth is, there is one rather simple explanation to much of the falloff in sales last month. It is likely the implementation of the “Know Before You Owe” mortgage rule, commonly known as the TILA-RESPA Integrated Disclosure (TRID) rule, which went into effect on October 3. These regulations caused house closings to be delayed by an extra three days in November as shown in the graph below.
Three days might not sound like a big deal. However, since there are only aabout 20 days in a month that a closing would normally take place (Mondays through Fridays), losing three days constitutes well over 10% of all closings. These sales aren’t lost, they’ve just moved into the next month’s numbers. In a DS News article on the subject yesterday, Auction.com EVP Rick Sharga explained:
“The most likely cause for the weak sales numbers is a delay in processing loans due to the new TRID mortgage requirements imposed by the CFPB. This is the biggest change in mortgage document processing in many years, and there have been numerous reports within the industry of problems implementing the process and the new documentation that comes with it.”
So how is the housing market actually doing?
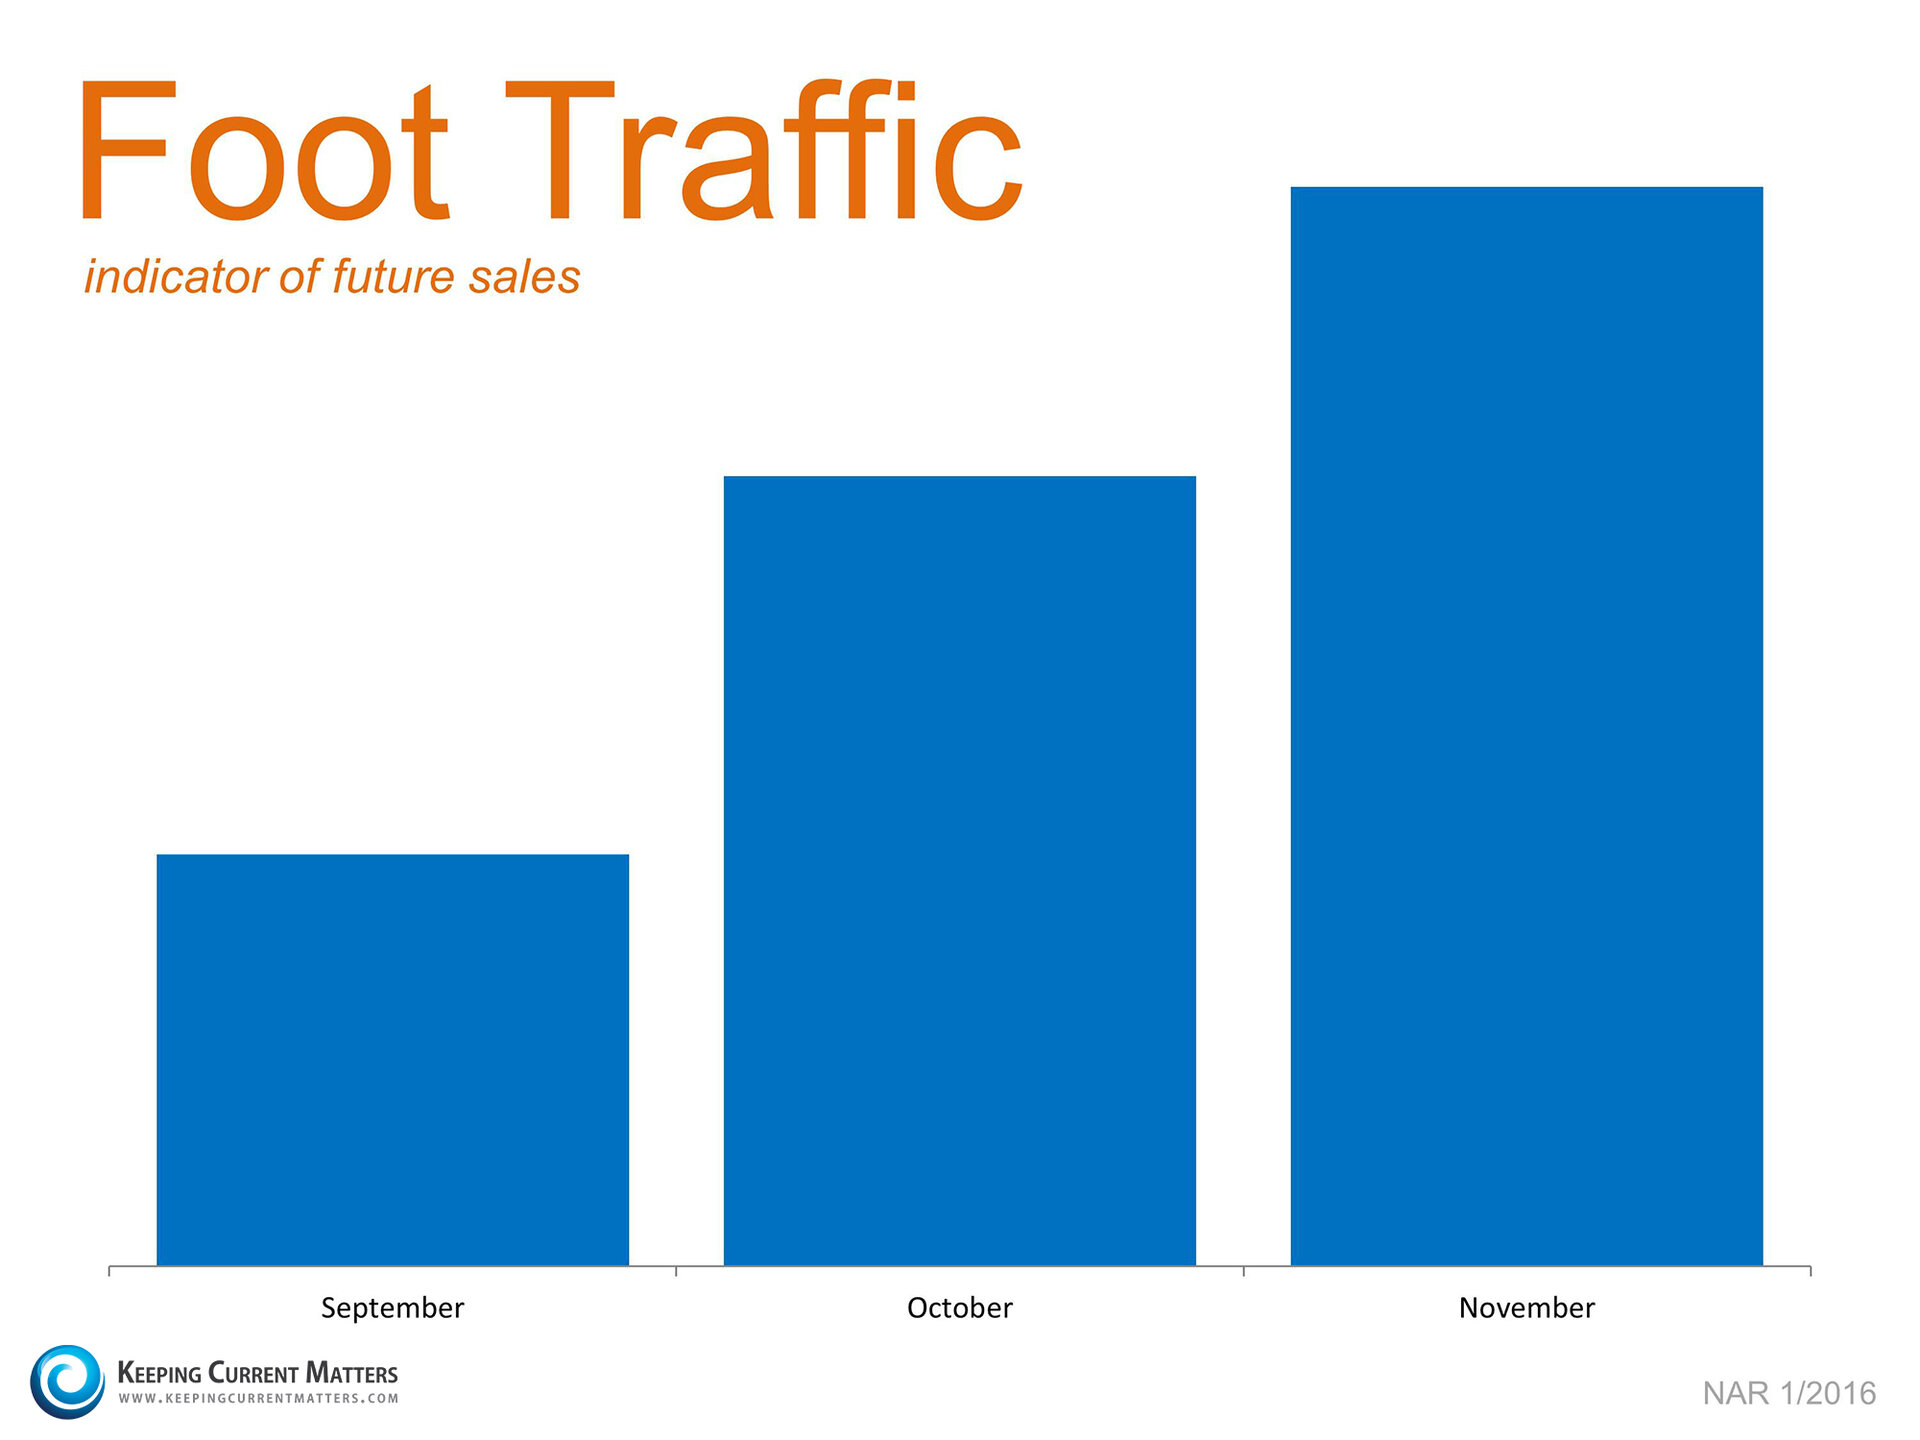
A better way to look at how well the housing market is doing, is to look at the Foot Traffic Report from NAR, which quantifies the number of prospective buyers that are actively looking for a home at the current time:
We can see immediately that demand to buy single family homes is increasing over the last few months – not decreasing.
What does this mean for you?
No matter what last month’s sales numbers show, the housing market is still doing well as demand remains strong.

